30
/
AIzaSyAYiBZKx7MnpbEhh9jyipgxe19OcubqV5w
April 1, 2024
217142
Pakistan
PAK
true
2
1
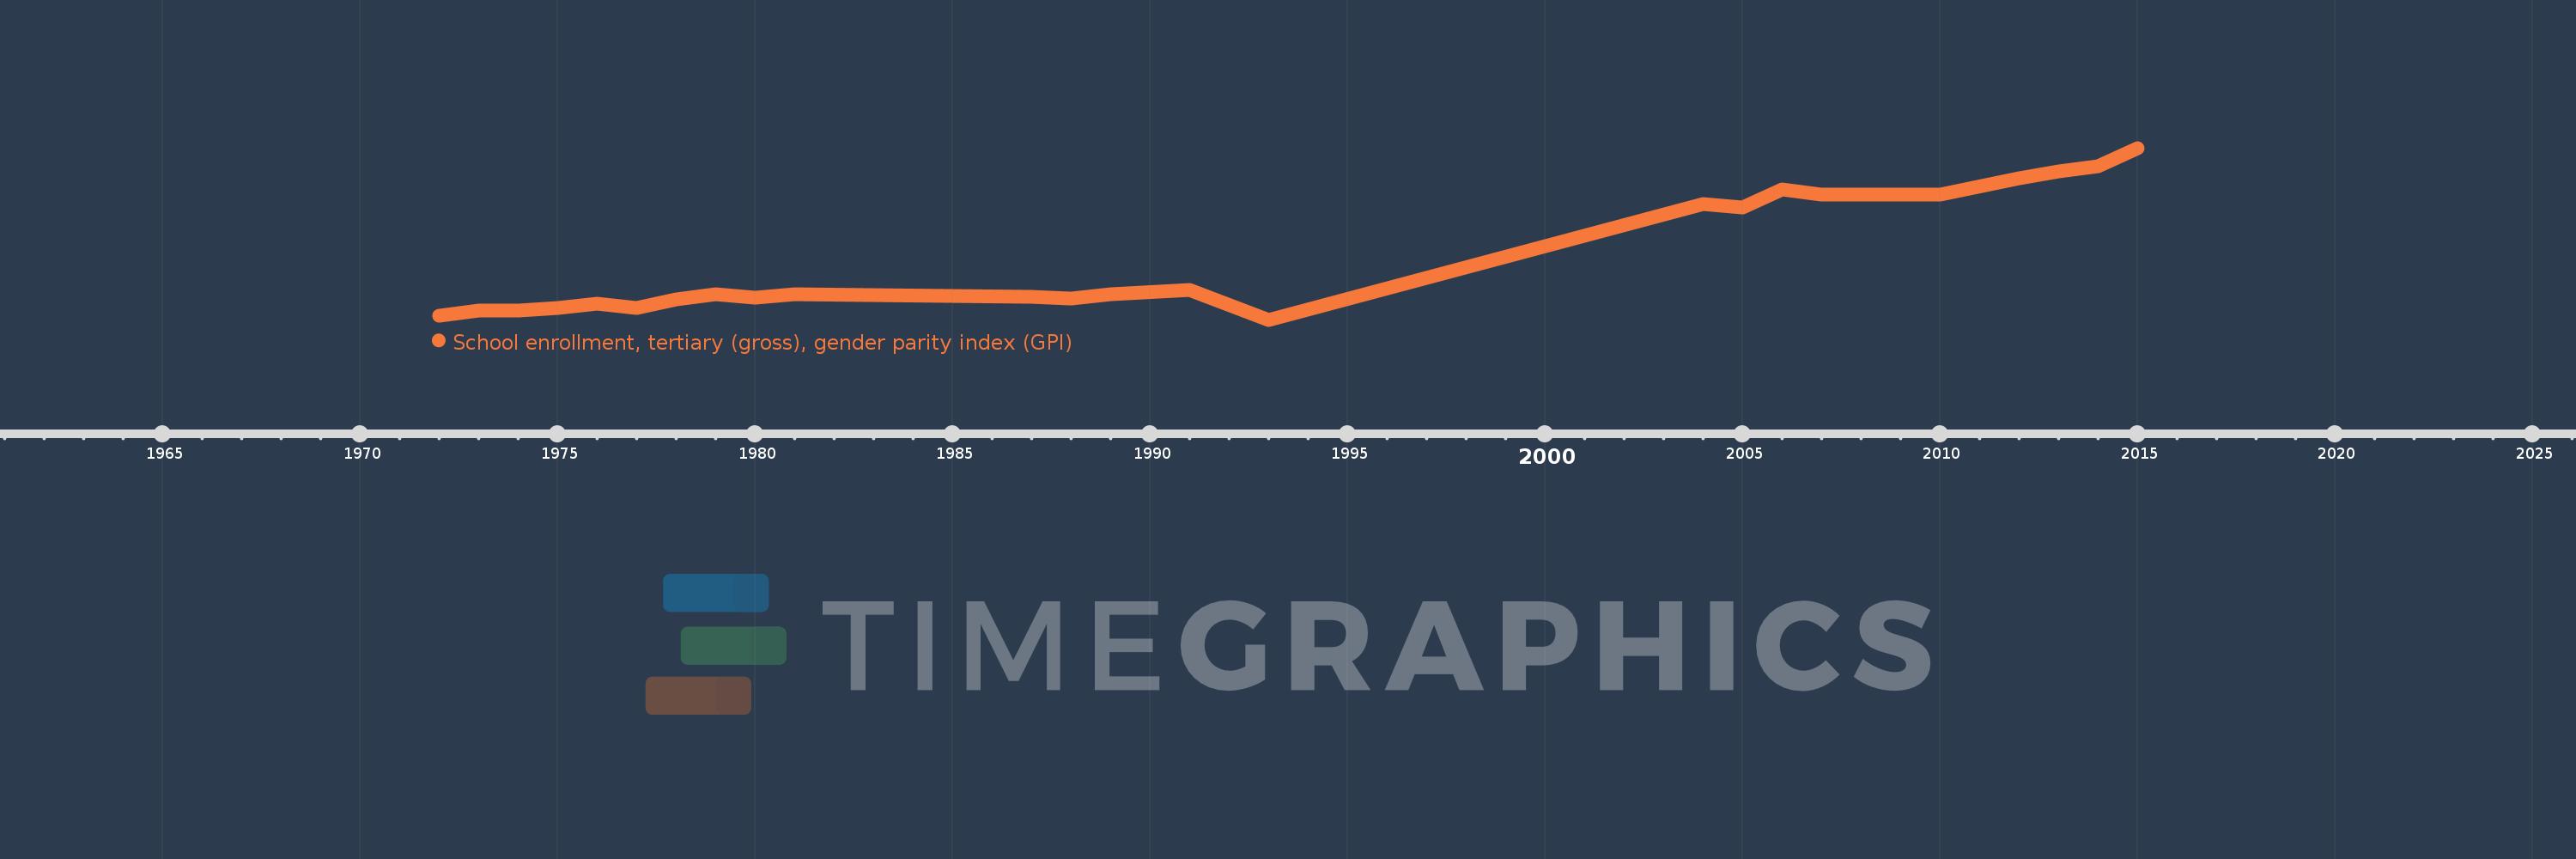
School enrollment, tertiary (gross), gender parity index (GPI)
2015,2014,2013,2012,2010,2009,2008,2007,2006,2005,2004,1993,1991,1989,1988,1987,1981,1980,1979,1978,1977,1976,1975,1974,1973,1972
