29
/
en
AIzaSyAYiBZKx7MnpbEhh9jyipgxe19OcubqV5w
April 1, 2024
25311
Caribbean small states
CSS
false
2
1
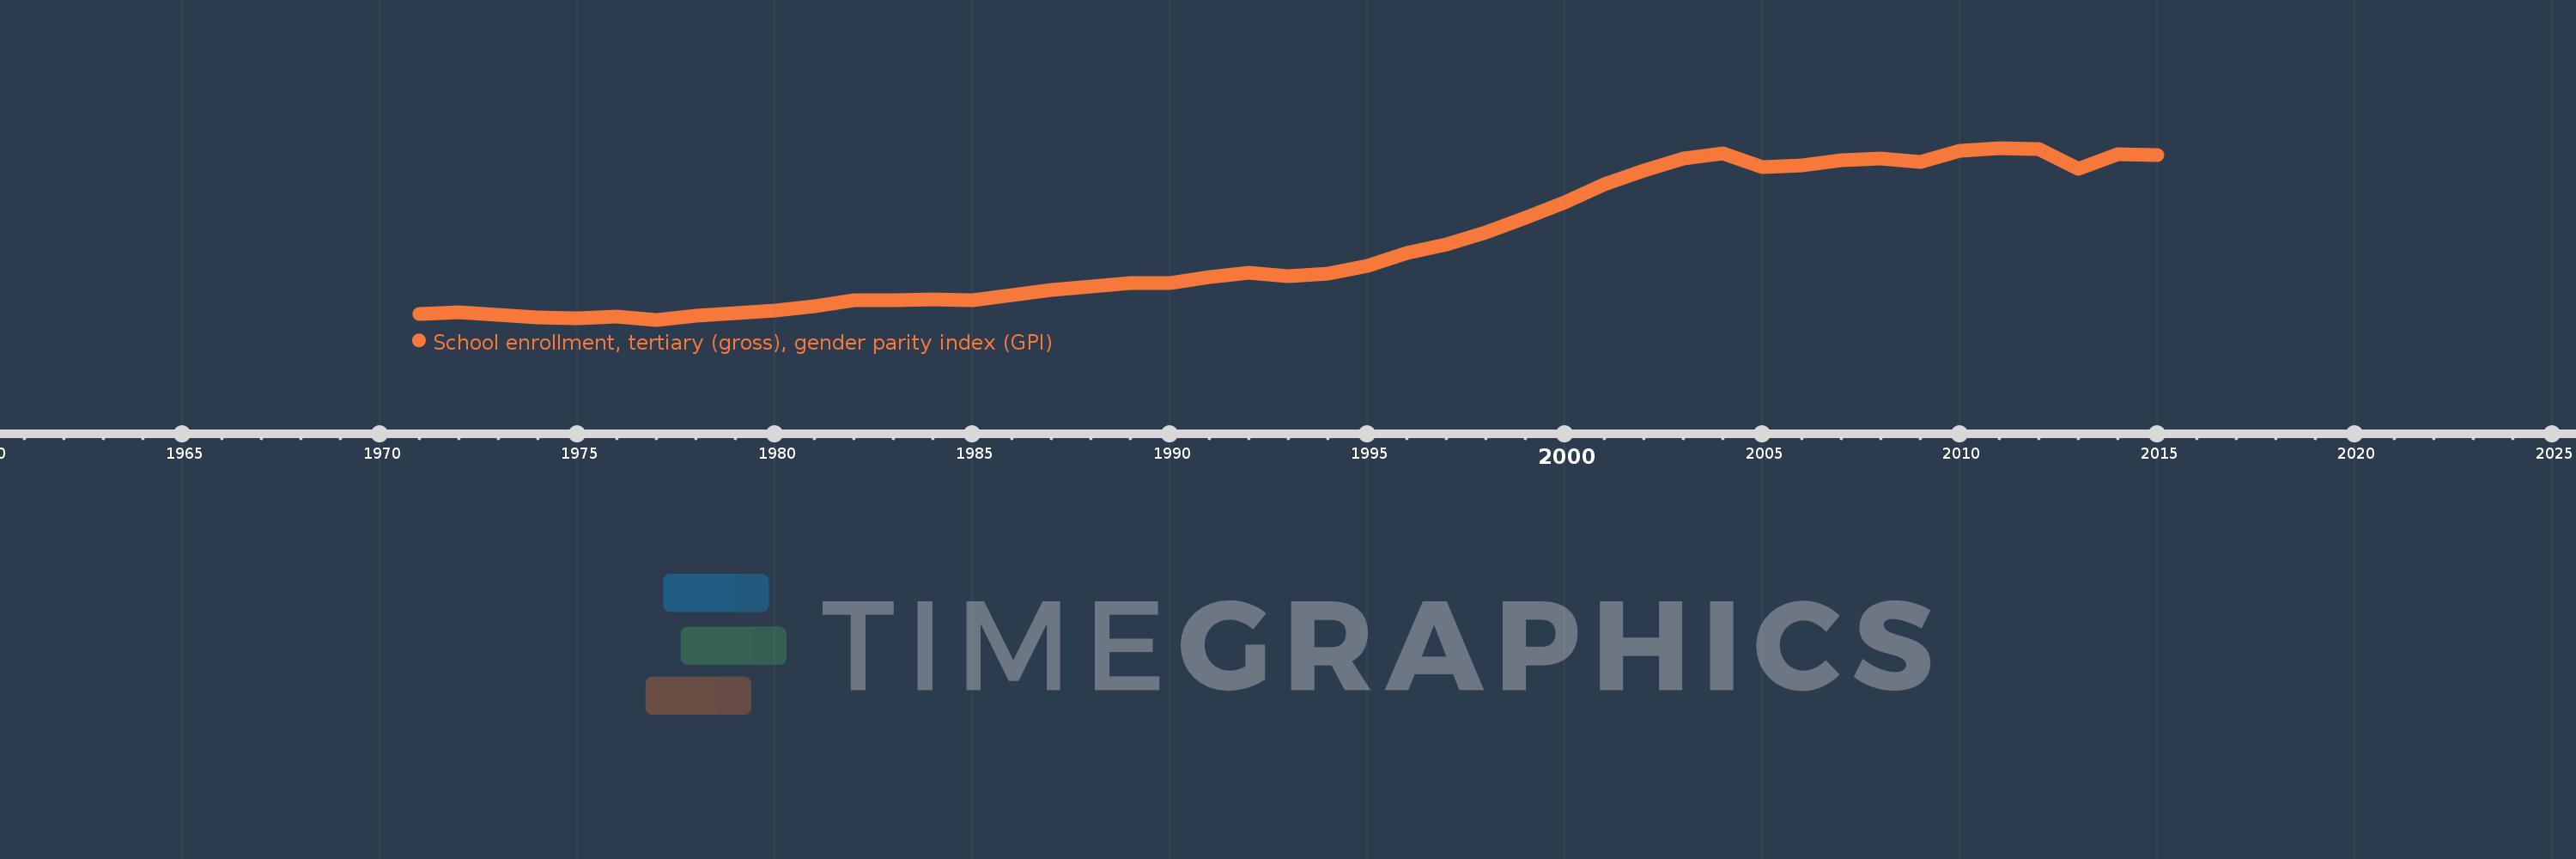
School enrollment, tertiary (gross), gender parity index (GPI)
2015,2014,2013,2012,2011,2010,2009,2008,2007,2006,2005,2004,2003,2002,2001,2000,1999,1998,1997,1996,1995,1994,1993,1992,1991,1990,1989,1988,1987,1986,1985,1984,1983,1982,1981,1980,1979,1978,1977,1976,1975,1974,1973,1972,1971
This statistics in other country:
AfghanistanAlbaniaAlgeriaAngolaAntigua and BarbudaArab WorldArgentinaArmeniaArubaAustraliaAustriaAzerbaijanBahamas, TheBahrainBangladeshBarbadosBelarusBelgiumBelizeBeninBermudaBhutanBoliviaBosnia and HerzegovinaBotswanaBrazilBrunei DarussalamBulgariaBurkina FasoBurundiCabo VerdeCambodiaCameroonCanadaCaribbean small statesCentral African RepublicCentral Europe and the BalticsChadChileChinaColombiaComorosCongo, Dem. Rep.Congo, Rep.Costa RicaCote d'IvoireCroatiaCubaCuracaoCyprusCzech RepublicDenmarkDjiboutiDominicaDominican RepublicEarly-demographic dividendEast Asia & PacificEast Asia & Pacific (excluding high income)East Asia & Pacific (IDA & IBRD countries)EcuadorEgypt, Arab Rep.El SalvadorEquatorial GuineaEritreaEstoniaEthiopiaEuro areaEurope & Central AsiaEurope & Central Asia (excluding high income)Europe & Central Asia (IDA & IBRD countries)European UnionFijiFinlandFragile and conflict affected situationsFranceGabonGambia, TheGeorgiaGermanyGhanaGreeceGrenadaGuatemalaGuineaGuinea-BissauGuyanaHaitiHeavily indebted poor countries (HIPC)High incomeHondurasHong Kong SAR, ChinaHungaryIBRD onlyIcelandIDA & IBRD totalIDA blendIDA onlyIDA totalIndiaIndonesiaIran, Islamic Rep.IraqIrelandIsraelItalyJamaicaJapanJordanKazakhstanKenyaKorea, Dem. People’s Rep.Korea, Rep.KuwaitKyrgyz RepublicLao PDRLate-demographic dividendLatin America & Caribbean Latin America & Caribbean (excluding high income)Latin America & the Caribbean (IDA & IBRD countries)LatviaLeast developed countries: UN classificationLebanonLesothoLiberiaLibyaLiechtensteinLithuaniaLow & middle incomeLow incomeLower middle incomeLuxembourgMacao SAR, ChinaMacedonia, FYRMadagascarMalawiMaldivesMaliMaltaMarshall IslandsMauritaniaMauritiusMexicoMicronesia, Fed. Sts.Middle East & North AfricaMiddle East & North Africa (excluding high income)Middle East & North Africa (IDA & IBRD countries)Middle incomeMoldovaMongoliaMontenegroMoroccoMozambiqueMyanmarNamibiaNepalNetherlandsNew ZealandNicaraguaNigerNigeriaNorth AmericaNorwayOECD membersOmanOther small statesPacific island small statesPakistanPalauPanamaPapua New GuineaParaguayPeruPhilippinesPolandPortugalPost-demographic dividendPre-demographic dividendPuerto RicoQatarRomaniaRussian FederationRwandaSamoaSan MarinoSao Tome and PrincipeSaudi ArabiaSenegalSerbiaSeychellesSierra LeoneSingaporeSlovak RepublicSloveniaSmall statesSomaliaSouth AfricaSouth AsiaSouth Asia (IDA & IBRD)SpainSri LankaSt. Kitts and NevisSt. LuciaSt. Vincent and the GrenadinesSub-Saharan Africa Sub-Saharan Africa (excluding high income)Sub-Saharan Africa (IDA & IBRD countries)SudanSurinameSwazilandSwedenSwitzerlandSyrian Arab RepublicTajikistanTanzaniaThailandTimor-LesteTogoTongaTrinidad and TobagoTunisiaTurkeyTurkmenistanUgandaUkraineUnited Arab EmiratesUnited KingdomUnited StatesUpper middle incomeUruguayUzbekistanVanuatuVenezuela, RBVietnamWest Bank and GazaWorldYemen, Rep.ZambiaZimbabwe Timeline:
This timeline shows a graph from 1971 to 2015 of Caribbean small states. No data until 1970. Number of actual observations by date: 45.
Source name:
World Development Indicators
Source organization:
United Nations Educational, Scientific, and Cultural Organization (UNESCO) Institute for Statistics.
Categories, topics:
Education, Gender, Social Development
Last updated:
apr 23, 2017
Indicators value changes by year
At the date of observation
Value
Absolute change
Change from previous value
jan 1, 1971
0.938
+0.938
0.0%
jan 1, 1972
0.953
+0.015
1.64%
jan 1, 1973
0.935
-0.019
-1.94%
jan 1, 1974
0.918
-0.017
-1.79%
jan 1, 1975
0.913
-0.005
-0.58%
jan 1, 1976
0.922
+0.009
0.96%
jan 1, 1977
0.903
-0.019
-2.04%
jan 1, 1978
0.927
+0.024
2.67%
jan 1, 1979
0.945
+0.018
1.96%
jan 1, 1980
0.966
+0.02
2.16%
jan 1, 1981
0.991
+0.026
2.64%
jan 1, 1982
1.029
+0.038
3.87%
jan 1, 1983
1.029
0.0
-0.05%
jan 1, 1984
1.038
+0.009
0.88%
jan 1, 1985
1.031
-0.007
-0.68%
jan 1, 1986
1.062
+0.031
3.0%
jan 1, 1987
1.096
+0.034
3.24%
jan 1, 1988
1.123
+0.027
2.45%
jan 1, 1989
1.141
+0.017
1.55%
jan 1, 1990
1.143
+0.002
0.21%
jan 1, 1991
1.184
+0.041
3.55%
jan 1, 1992
1.21
+0.026
2.22%
jan 1, 1993
1.187
-0.023
-1.9%
jan 1, 1994
1.205
+0.018
1.5%
jan 1, 1995
1.259
+0.055
4.53%
jan 1, 1996
1.343
+0.084
6.65%
jan 1, 1997
1.398
+0.055
4.09%
jan 1, 1998
1.476
+0.078
5.61%
jan 1, 1999
1.573
+0.096
6.51%
jan 1, 2000
1.673
+0.1
6.38%
jan 1, 2001
1.794
+0.121
7.26%
jan 1, 2002
1.881
+0.087
4.84%
jan 1, 2003
1.961
+0.08
4.25%
jan 1, 2004
1.994
+0.033
1.66%
jan 1, 2005
1.905
-0.089
-4.45%
jan 1, 2006
1.913
+0.008
0.41%
jan 1, 2007
1.952
+0.039
2.04%
jan 1, 2008
1.958
+0.007
0.33%
jan 1, 2009
1.94
-0.018
-0.92%
jan 1, 2010
2.011
+0.07
3.62%
jan 1, 2011
2.03
+0.02
0.97%
jan 1, 2012
2.025
-0.005
-0.25%
jan 1, 2013
1.894
-0.131
-6.47%
jan 1, 2014
1.991
+0.097
5.12%
jan 1, 2015
1.983
-0.008
-0.39%
Ranking of countries by current statistics by years


Comments: