29
/
en
AIzaSyAYiBZKx7MnpbEhh9jyipgxe19OcubqV5w
April 1, 2024
225374
Poland
POL
true
2
1
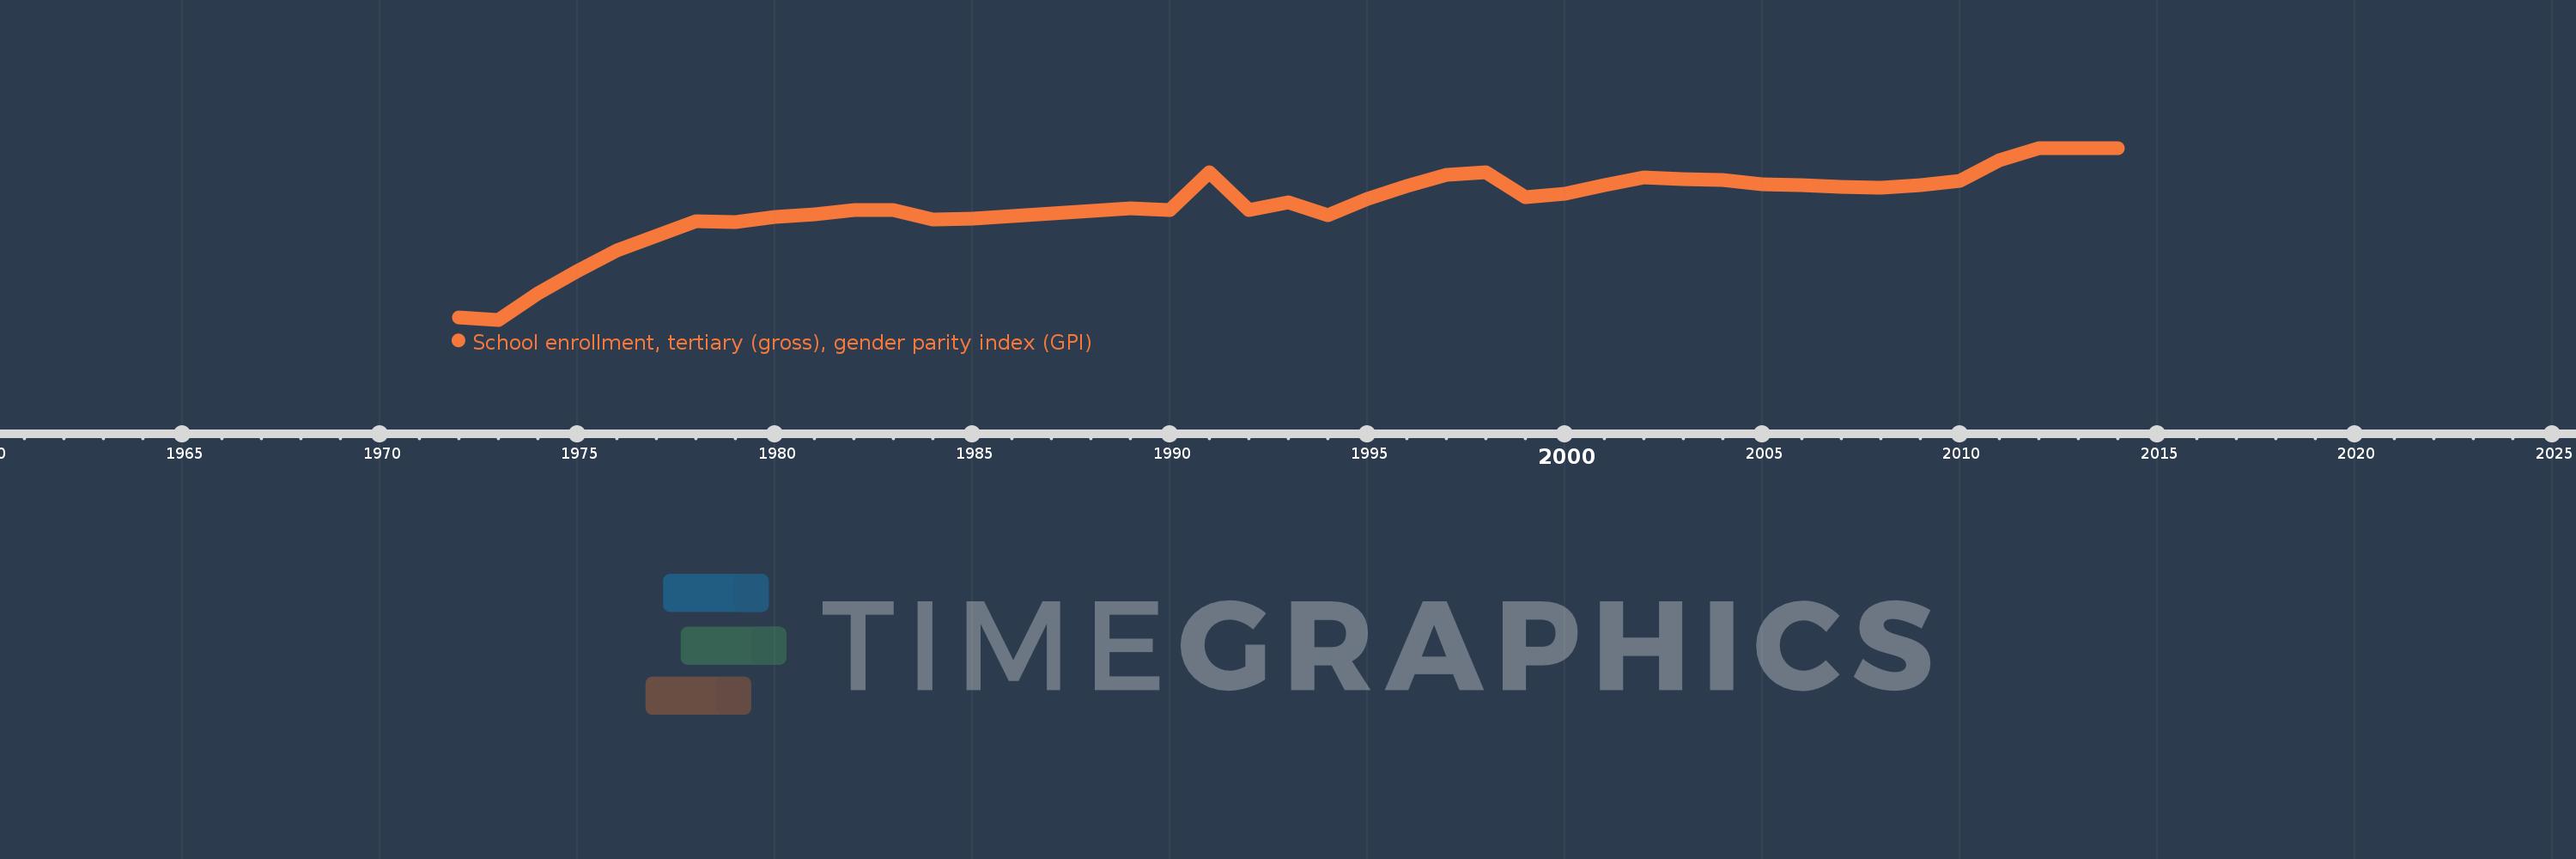
School enrollment, tertiary (gross), gender parity index (GPI)
2014,2013,2012,2011,2010,2009,2008,2007,2006,2005,2004,2003,2002,2001,2000,1999,1998,1997,1996,1995,1994,1993,1992,1991,1990,1989,1988,1987,1986,1985,1984,1983,1982,1981,1980,1979,1978,1977,1976,1975,1974,1973,1972
This statistics in other country:
AfghanistanAlbaniaAlgeriaAngolaAntigua and BarbudaArab WorldArgentinaArmeniaArubaAustraliaAustriaAzerbaijanBahamas, TheBahrainBangladeshBarbadosBelarusBelgiumBelizeBeninBermudaBhutanBoliviaBosnia and HerzegovinaBotswanaBrazilBrunei DarussalamBulgariaBurkina FasoBurundiCabo VerdeCambodiaCameroonCanadaCaribbean small statesCentral African RepublicCentral Europe and the BalticsChadChileChinaColombiaComorosCongo, Dem. Rep.Congo, Rep.Costa RicaCote d'IvoireCroatiaCubaCuracaoCyprusCzech RepublicDenmarkDjiboutiDominicaDominican RepublicEarly-demographic dividendEast Asia & PacificEast Asia & Pacific (excluding high income)East Asia & Pacific (IDA & IBRD countries)EcuadorEgypt, Arab Rep.El SalvadorEquatorial GuineaEritreaEstoniaEthiopiaEuro areaEurope & Central AsiaEurope & Central Asia (excluding high income)Europe & Central Asia (IDA & IBRD countries)European UnionFijiFinlandFragile and conflict affected situationsFranceGabonGambia, TheGeorgiaGermanyGhanaGreeceGrenadaGuatemalaGuineaGuinea-BissauGuyanaHaitiHeavily indebted poor countries (HIPC)High incomeHondurasHong Kong SAR, ChinaHungaryIBRD onlyIcelandIDA & IBRD totalIDA blendIDA onlyIDA totalIndiaIndonesiaIran, Islamic Rep.IraqIrelandIsraelItalyJamaicaJapanJordanKazakhstanKenyaKorea, Dem. People’s Rep.Korea, Rep.KuwaitKyrgyz RepublicLao PDRLate-demographic dividendLatin America & Caribbean Latin America & Caribbean (excluding high income)Latin America & the Caribbean (IDA & IBRD countries)LatviaLeast developed countries: UN classificationLebanonLesothoLiberiaLibyaLiechtensteinLithuaniaLow & middle incomeLow incomeLower middle incomeLuxembourgMacao SAR, ChinaMacedonia, FYRMadagascarMalawiMaldivesMaliMaltaMarshall IslandsMauritaniaMauritiusMexicoMicronesia, Fed. Sts.Middle East & North AfricaMiddle East & North Africa (excluding high income)Middle East & North Africa (IDA & IBRD countries)Middle incomeMoldovaMongoliaMontenegroMoroccoMozambiqueMyanmarNamibiaNepalNetherlandsNew ZealandNicaraguaNigerNigeriaNorth AmericaNorwayOECD membersOmanOther small statesPacific island small statesPakistanPalauPanamaPapua New GuineaParaguayPeruPhilippinesPolandPortugalPost-demographic dividendPre-demographic dividendPuerto RicoQatarRomaniaRussian FederationRwandaSamoaSan MarinoSao Tome and PrincipeSaudi ArabiaSenegalSerbiaSeychellesSierra LeoneSingaporeSlovak RepublicSloveniaSmall statesSomaliaSouth AfricaSouth AsiaSouth Asia (IDA & IBRD)SpainSri LankaSt. Kitts and NevisSt. LuciaSt. Vincent and the GrenadinesSub-Saharan Africa Sub-Saharan Africa (excluding high income)Sub-Saharan Africa (IDA & IBRD countries)SudanSurinameSwazilandSwedenSwitzerlandSyrian Arab RepublicTajikistanTanzaniaThailandTimor-LesteTogoTongaTrinidad and TobagoTunisiaTurkeyTurkmenistanUgandaUkraineUnited Arab EmiratesUnited KingdomUnited StatesUpper middle incomeUruguayUzbekistanVanuatuVenezuela, RBVietnamWest Bank and GazaWorldYemen, Rep.ZambiaZimbabwe Timeline:
This timeline shows a graph from 1972 to 2014 of Poland. No data until 1971. Number of actual observations by date: 43.
Source name:
World Development Indicators
Source organization:
United Nations Educational, Scientific, and Cultural Organization (UNESCO) Institute for Statistics.
Categories, topics:
Education, Gender, Social Development
Last updated:
apr 23, 2017
Indicators value changes by year
At the date of observation
Value
Absolute change
Change from previous value
jan 1, 1972
0.926
+0.926
0.0%
jan 1, 1973
0.916
-0.01
-1.11%
jan 1, 1974
1.014
+0.098
10.68%
jan 1, 1975
1.096
+0.082
8.13%
jan 1, 1976
1.173
+0.077
7.0%
jan 1, 1977
1.225
+0.052
4.44%
jan 1, 1978
1.281
+0.056
4.58%
jan 1, 1979
1.278
-0.004
-0.29%
jan 1, 1980
1.295
+0.017
1.35%
jan 1, 1981
1.305
+0.01
0.75%
jan 1, 1982
1.32
+0.015
1.14%
jan 1, 1983
1.321
+0.001
0.09%
jan 1, 1984
1.286
-0.035
-2.64%
jan 1, 1985
1.29
+0.004
0.33%
jan 1, 1986
1.298
+0.007
0.58%
jan 1, 1987
1.308
+0.01
0.78%
jan 1, 1988
1.317
+0.009
0.69%
jan 1, 1989
1.328
+0.011
0.84%
jan 1, 1990
1.32
-0.008
-0.61%
jan 1, 1991
1.462
+0.143
10.81%
jan 1, 1992
1.321
-0.141
-9.67%
jan 1, 1993
1.349
+0.028
2.09%
jan 1, 1994
1.301
-0.047
-3.49%
jan 1, 1995
1.362
+0.06
4.63%
jan 1, 1996
1.409
+0.047
3.44%
jan 1, 1997
1.451
+0.042
3.01%
jan 1, 1998
1.461
+0.01
0.71%
jan 1, 1999
1.369
-0.092
-6.29%
jan 1, 2000
1.381
+0.011
0.84%
jan 1, 2001
1.412
+0.031
2.27%
jan 1, 2002
1.443
+0.031
2.2%
jan 1, 2003
1.437
-0.007
-0.46%
jan 1, 2004
1.432
-0.005
-0.32%
jan 1, 2005
1.417
-0.015
-1.08%
jan 1, 2006
1.413
-0.003
-0.23%
jan 1, 2007
1.406
-0.007
-0.51%
jan 1, 2008
1.403
-0.003
-0.21%
jan 1, 2009
1.414
+0.01
0.74%
jan 1, 2010
1.43
+0.017
1.17%
jan 1, 2011
1.507
+0.077
5.4%
jan 1, 2012
1.551
+0.044
2.9%
jan 1, 2013
1.551
0.0
-0.03%
jan 1, 2014
1.549
-0.002
-0.12%
Ranking of countries by current statistics by years


Comments: