29
/
en
AIzaSyAYiBZKx7MnpbEhh9jyipgxe19OcubqV5w
April 1, 2024
48544
Middle East & North Africa
MEA
false
2
1
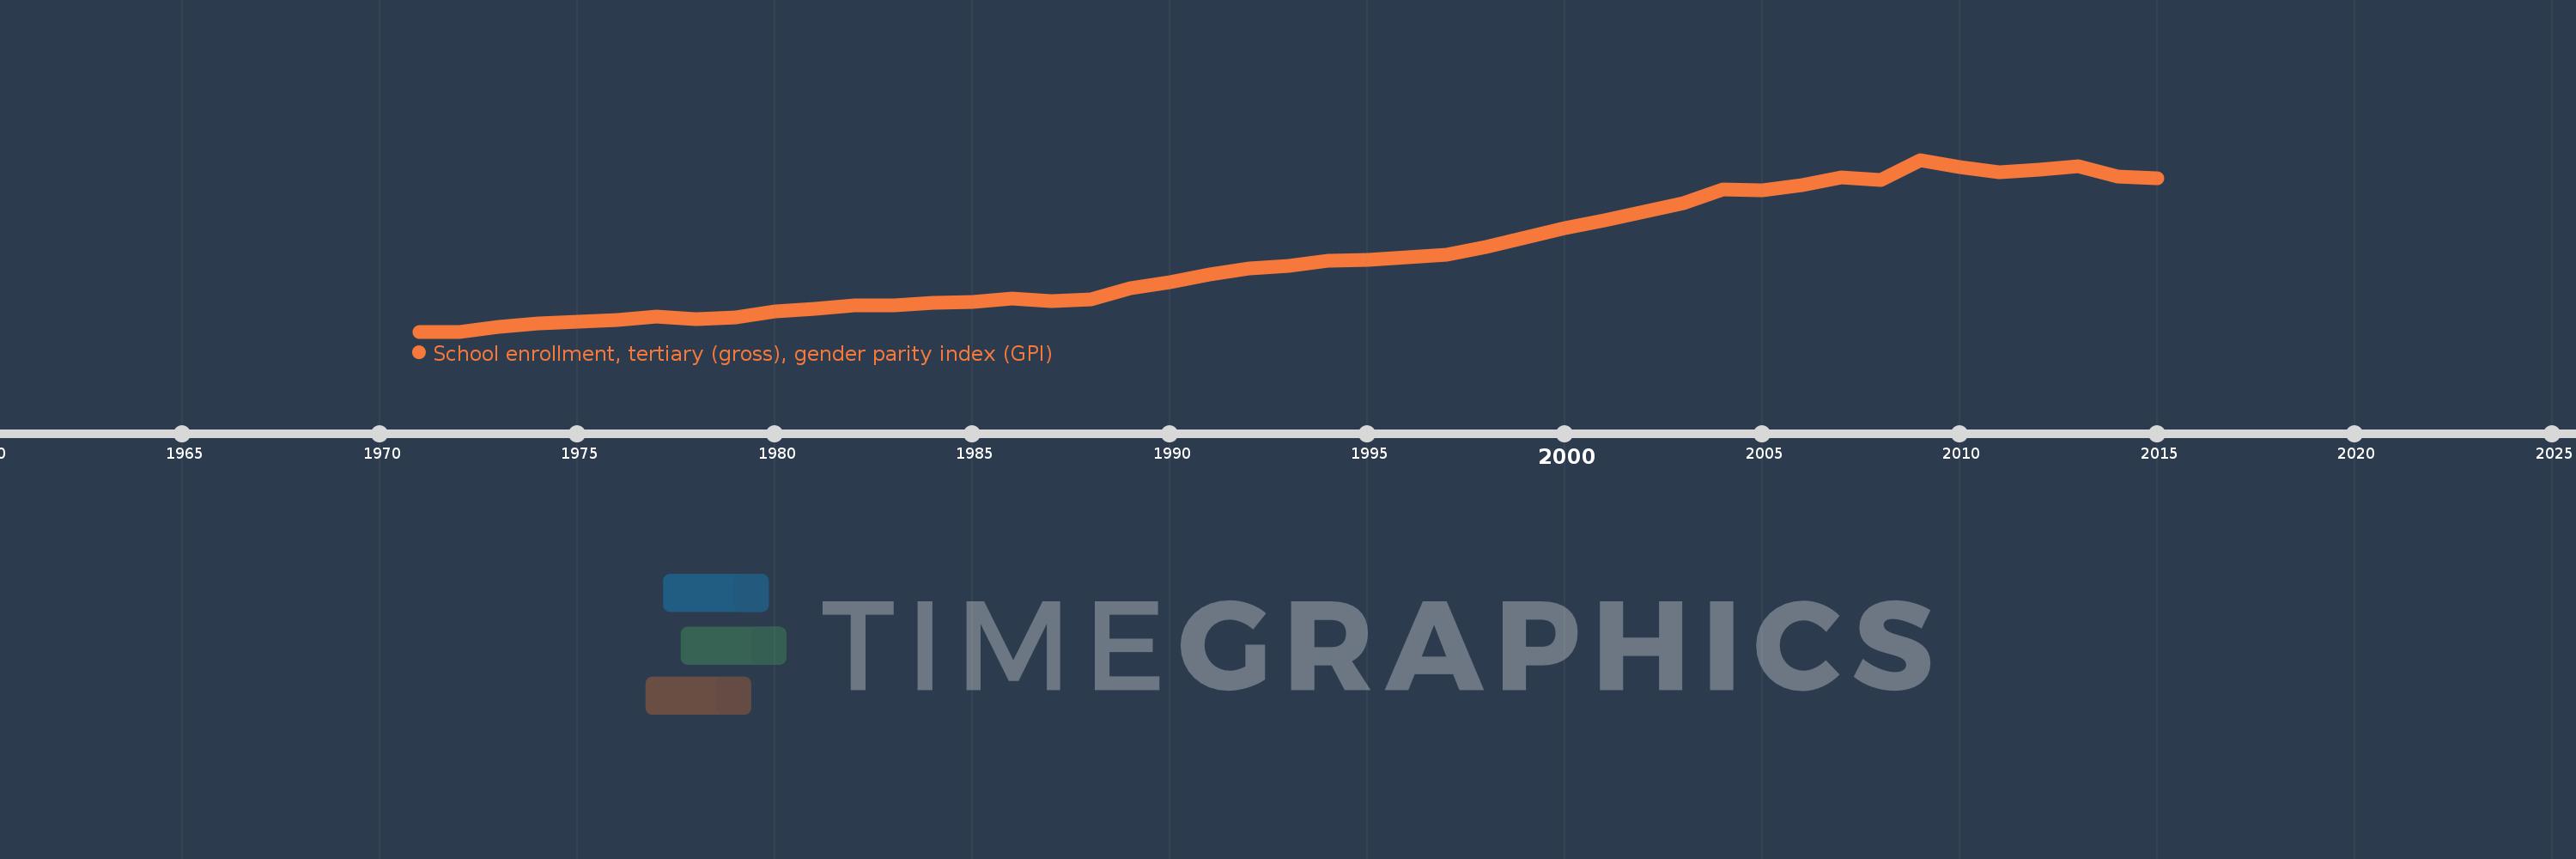
School enrollment, tertiary (gross), gender parity index (GPI)
2015,2014,2013,2012,2011,2010,2009,2008,2007,2006,2005,2004,2003,2002,2001,2000,1999,1998,1997,1996,1995,1994,1993,1992,1991,1990,1989,1988,1987,1986,1985,1984,1983,1982,1981,1980,1979,1978,1977,1976,1975,1974,1973,1972,1971
This statistics in other country:
AfghanistanAlbaniaAlgeriaAngolaAntigua and BarbudaArab WorldArgentinaArmeniaArubaAustraliaAustriaAzerbaijanBahamas, TheBahrainBangladeshBarbadosBelarusBelgiumBelizeBeninBermudaBhutanBoliviaBosnia and HerzegovinaBotswanaBrazilBrunei DarussalamBulgariaBurkina FasoBurundiCabo VerdeCambodiaCameroonCanadaCaribbean small statesCentral African RepublicCentral Europe and the BalticsChadChileChinaColombiaComorosCongo, Dem. Rep.Congo, Rep.Costa RicaCote d'IvoireCroatiaCubaCuracaoCyprusCzech RepublicDenmarkDjiboutiDominicaDominican RepublicEarly-demographic dividendEast Asia & PacificEast Asia & Pacific (excluding high income)East Asia & Pacific (IDA & IBRD countries)EcuadorEgypt, Arab Rep.El SalvadorEquatorial GuineaEritreaEstoniaEthiopiaEuro areaEurope & Central AsiaEurope & Central Asia (excluding high income)Europe & Central Asia (IDA & IBRD countries)European UnionFijiFinlandFragile and conflict affected situationsFranceGabonGambia, TheGeorgiaGermanyGhanaGreeceGrenadaGuatemalaGuineaGuinea-BissauGuyanaHaitiHeavily indebted poor countries (HIPC)High incomeHondurasHong Kong SAR, ChinaHungaryIBRD onlyIcelandIDA & IBRD totalIDA blendIDA onlyIDA totalIndiaIndonesiaIran, Islamic Rep.IraqIrelandIsraelItalyJamaicaJapanJordanKazakhstanKenyaKorea, Dem. People’s Rep.Korea, Rep.KuwaitKyrgyz RepublicLao PDRLate-demographic dividendLatin America & Caribbean Latin America & Caribbean (excluding high income)Latin America & the Caribbean (IDA & IBRD countries)LatviaLeast developed countries: UN classificationLebanonLesothoLiberiaLibyaLiechtensteinLithuaniaLow & middle incomeLow incomeLower middle incomeLuxembourgMacao SAR, ChinaMacedonia, FYRMadagascarMalawiMaldivesMaliMaltaMarshall IslandsMauritaniaMauritiusMexicoMicronesia, Fed. Sts.Middle East & North AfricaMiddle East & North Africa (excluding high income)Middle East & North Africa (IDA & IBRD countries)Middle incomeMoldovaMongoliaMontenegroMoroccoMozambiqueMyanmarNamibiaNepalNetherlandsNew ZealandNicaraguaNigerNigeriaNorth AmericaNorwayOECD membersOmanOther small statesPacific island small statesPakistanPalauPanamaPapua New GuineaParaguayPeruPhilippinesPolandPortugalPost-demographic dividendPre-demographic dividendPuerto RicoQatarRomaniaRussian FederationRwandaSamoaSan MarinoSao Tome and PrincipeSaudi ArabiaSenegalSerbiaSeychellesSierra LeoneSingaporeSlovak RepublicSloveniaSmall statesSomaliaSouth AfricaSouth AsiaSouth Asia (IDA & IBRD)SpainSri LankaSt. Kitts and NevisSt. LuciaSt. Vincent and the GrenadinesSub-Saharan Africa Sub-Saharan Africa (excluding high income)Sub-Saharan Africa (IDA & IBRD countries)SudanSurinameSwazilandSwedenSwitzerlandSyrian Arab RepublicTajikistanTanzaniaThailandTimor-LesteTogoTongaTrinidad and TobagoTunisiaTurkeyTurkmenistanUgandaUkraineUnited Arab EmiratesUnited KingdomUnited StatesUpper middle incomeUruguayUzbekistanVanuatuVenezuela, RBVietnamWest Bank and GazaWorldYemen, Rep.ZambiaZimbabwe Timeline:
This timeline shows a graph from 1971 to 2015 of Middle East & North Africa. No data until 1970. Number of actual observations by date: 45.
Source name:
World Development Indicators
Source organization:
United Nations Educational, Scientific, and Cultural Organization (UNESCO) Institute for Statistics.
Categories, topics:
Education, Gender, Social Development
Last updated:
apr 23, 2017
Indicators value changes by year
At the date of observation
Value
Absolute change
Change from previous value
jan 1, 1971
0.457
+0.457
0.0%
jan 1, 1972
0.457
+0.0
0.09%
jan 1, 1973
0.475
+0.017
3.77%
jan 1, 1974
0.486
+0.011
2.28%
jan 1, 1975
0.493
+0.008
1.59%
jan 1, 1976
0.5
+0.006
1.28%
jan 1, 1977
0.513
+0.014
2.7%
jan 1, 1978
0.503
-0.01
-1.98%
jan 1, 1979
0.508
+0.005
1.0%
jan 1, 1980
0.53
+0.022
4.35%
jan 1, 1981
0.541
+0.011
2.08%
jan 1, 1982
0.553
+0.012
2.28%
jan 1, 1983
0.553
0.0
0.0%
jan 1, 1984
0.561
+0.007
1.32%
jan 1, 1985
0.565
+0.005
0.84%
jan 1, 1986
0.579
+0.014
2.44%
jan 1, 1987
0.57
-0.01
-1.65%
jan 1, 1988
0.574
+0.004
0.68%
jan 1, 1989
0.617
+0.044
7.63%
jan 1, 1990
0.638
+0.021
3.41%
jan 1, 1991
0.666
+0.027
4.24%
jan 1, 1992
0.689
+0.024
3.59%
jan 1, 1993
0.697
+0.007
1.08%
jan 1, 1994
0.716
+0.019
2.74%
jan 1, 1995
0.719
+0.003
0.44%
jan 1, 1996
0.73
+0.011
1.54%
jan 1, 1997
0.739
+0.009
1.16%
jan 1, 1998
0.766
+0.027
3.63%
jan 1, 1999
0.801
+0.036
4.64%
jan 1, 2000
0.834
+0.033
4.13%
jan 1, 2001
0.864
+0.03
3.58%
jan 1, 2002
0.894
+0.03
3.45%
jan 1, 2003
0.926
+0.032
3.6%
jan 1, 2004
0.977
+0.051
5.51%
jan 1, 2005
0.973
-0.004
-0.4%
jan 1, 2006
0.991
+0.018
1.88%
jan 1, 2007
1.022
+0.03
3.05%
jan 1, 2008
1.011
-0.01
-1.02%
jan 1, 2009
1.085
+0.074
7.28%
jan 1, 2010
1.057
-0.028
-2.57%
jan 1, 2011
1.038
-0.019
-1.81%
jan 1, 2012
1.048
+0.01
0.95%
jan 1, 2013
1.06
+0.013
1.19%
jan 1, 2014
1.025
-0.035
-3.33%
jan 1, 2015
1.017
-0.008
-0.74%
Ranking of countries by current statistics by years


Comments: