29
/
en
AIzaSyAYiBZKx7MnpbEhh9jyipgxe19OcubqV5w
April 1, 2024
276149
United Kingdom
GBR
true
2
1
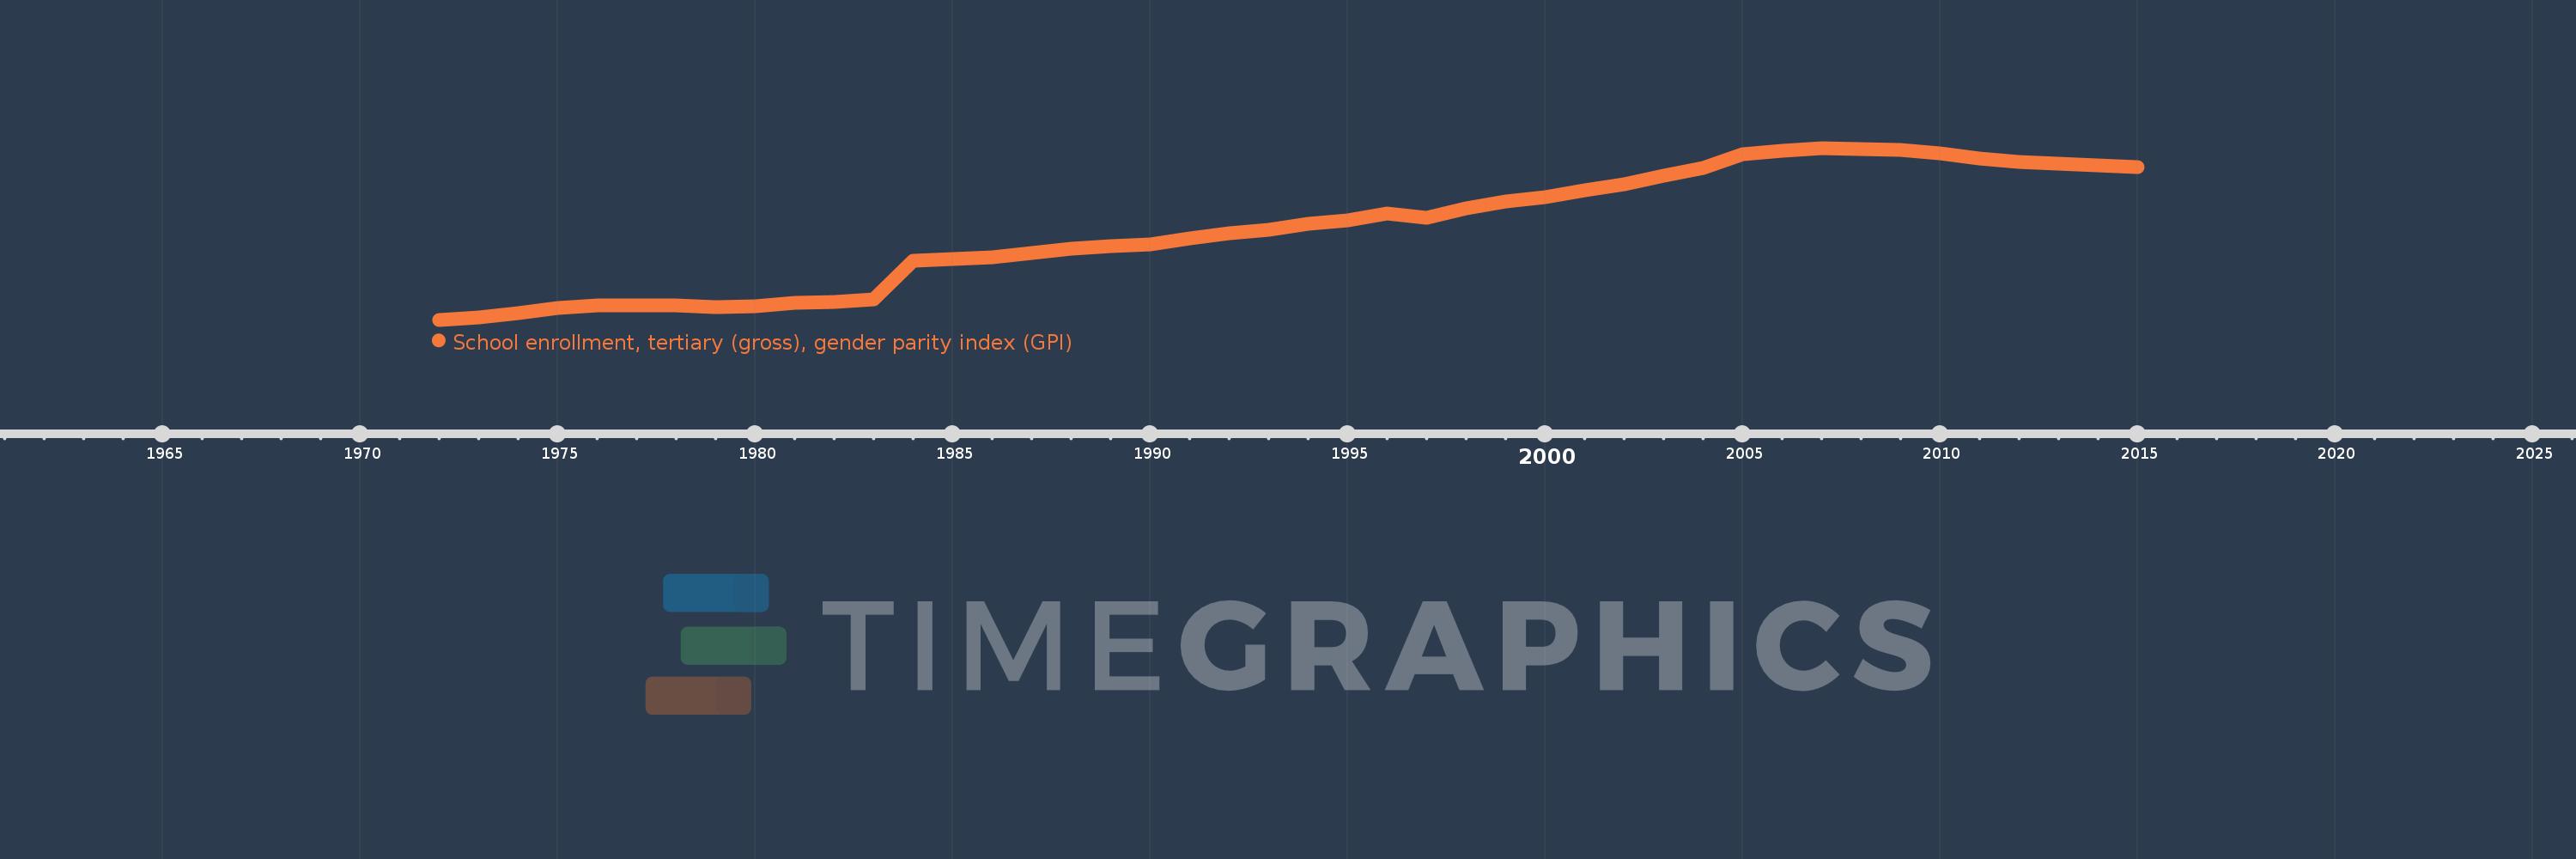
School enrollment, tertiary (gross), gender parity index (GPI)
2015,2014,2013,2012,2011,2010,2009,2008,2007,2006,2005,2004,2003,2002,2001,2000,1999,1998,1997,1996,1995,1994,1993,1992,1991,1990,1989,1988,1987,1986,1985,1984,1983,1982,1981,1980,1979,1978,1977,1976,1975,1974,1973,1972
This statistics in other country:
AfghanistanAlbaniaAlgeriaAngolaAntigua and BarbudaArab WorldArgentinaArmeniaArubaAustraliaAustriaAzerbaijanBahamas, TheBahrainBangladeshBarbadosBelarusBelgiumBelizeBeninBermudaBhutanBoliviaBosnia and HerzegovinaBotswanaBrazilBrunei DarussalamBulgariaBurkina FasoBurundiCabo VerdeCambodiaCameroonCanadaCaribbean small statesCentral African RepublicCentral Europe and the BalticsChadChileChinaColombiaComorosCongo, Dem. Rep.Congo, Rep.Costa RicaCote d'IvoireCroatiaCubaCuracaoCyprusCzech RepublicDenmarkDjiboutiDominicaDominican RepublicEarly-demographic dividendEast Asia & PacificEast Asia & Pacific (excluding high income)East Asia & Pacific (IDA & IBRD countries)EcuadorEgypt, Arab Rep.El SalvadorEquatorial GuineaEritreaEstoniaEthiopiaEuro areaEurope & Central AsiaEurope & Central Asia (excluding high income)Europe & Central Asia (IDA & IBRD countries)European UnionFijiFinlandFragile and conflict affected situationsFranceGabonGambia, TheGeorgiaGermanyGhanaGreeceGrenadaGuatemalaGuineaGuinea-BissauGuyanaHaitiHeavily indebted poor countries (HIPC)High incomeHondurasHong Kong SAR, ChinaHungaryIBRD onlyIcelandIDA & IBRD totalIDA blendIDA onlyIDA totalIndiaIndonesiaIran, Islamic Rep.IraqIrelandIsraelItalyJamaicaJapanJordanKazakhstanKenyaKorea, Dem. People’s Rep.Korea, Rep.KuwaitKyrgyz RepublicLao PDRLate-demographic dividendLatin America & Caribbean Latin America & Caribbean (excluding high income)Latin America & the Caribbean (IDA & IBRD countries)LatviaLeast developed countries: UN classificationLebanonLesothoLiberiaLibyaLiechtensteinLithuaniaLow & middle incomeLow incomeLower middle incomeLuxembourgMacao SAR, ChinaMacedonia, FYRMadagascarMalawiMaldivesMaliMaltaMarshall IslandsMauritaniaMauritiusMexicoMicronesia, Fed. Sts.Middle East & North AfricaMiddle East & North Africa (excluding high income)Middle East & North Africa (IDA & IBRD countries)Middle incomeMoldovaMongoliaMontenegroMoroccoMozambiqueMyanmarNamibiaNepalNetherlandsNew ZealandNicaraguaNigerNigeriaNorth AmericaNorwayOECD membersOmanOther small statesPacific island small statesPakistanPalauPanamaPapua New GuineaParaguayPeruPhilippinesPolandPortugalPost-demographic dividendPre-demographic dividendPuerto RicoQatarRomaniaRussian FederationRwandaSamoaSan MarinoSao Tome and PrincipeSaudi ArabiaSenegalSerbiaSeychellesSierra LeoneSingaporeSlovak RepublicSloveniaSmall statesSomaliaSouth AfricaSouth AsiaSouth Asia (IDA & IBRD)SpainSri LankaSt. Kitts and NevisSt. LuciaSt. Vincent and the GrenadinesSub-Saharan Africa Sub-Saharan Africa (excluding high income)Sub-Saharan Africa (IDA & IBRD countries)SudanSurinameSwazilandSwedenSwitzerlandSyrian Arab RepublicTajikistanTanzaniaThailandTimor-LesteTogoTongaTrinidad and TobagoTunisiaTurkeyTurkmenistanUgandaUkraineUnited Arab EmiratesUnited KingdomUnited StatesUpper middle incomeUruguayUzbekistanVanuatuVenezuela, RBVietnamWest Bank and GazaWorldYemen, Rep.ZambiaZimbabwe Timeline:
This timeline shows a graph from 1972 to 2015 of United Kingdom. No data until 1971. Number of actual observations by date: 44.
Source name:
World Development Indicators
Source organization:
United Nations Educational, Scientific, and Cultural Organization (UNESCO) Institute for Statistics.
Categories, topics:
Education, Gender, Social Development
Last updated:
apr 23, 2017
Indicators value changes by year
At the date of observation
Value
Absolute change
Change from previous value
jan 1, 1972
0.509
+0.509
0.0%
jan 1, 1973
0.523
+0.013
2.6%
jan 1, 1974
0.545
+0.023
4.35%
jan 1, 1975
0.571
+0.025
4.62%
jan 1, 1976
0.582
+0.012
2.06%
jan 1, 1977
0.586
+0.003
0.56%
jan 1, 1978
0.582
-0.003
-0.59%
jan 1, 1979
0.577
-0.005
-0.87%
jan 1, 1980
0.579
+0.002
0.4%
jan 1, 1981
0.598
+0.018
3.13%
jan 1, 1982
0.6
+0.003
0.46%
jan 1, 1983
0.617
+0.016
2.75%
jan 1, 1984
0.816
+0.199
32.22%
jan 1, 1985
0.824
+0.009
1.1%
jan 1, 1986
0.836
+0.011
1.37%
jan 1, 1987
0.859
+0.024
2.83%
jan 1, 1988
0.882
+0.023
2.64%
jan 1, 1989
0.892
+0.01
1.13%
jan 1, 1990
0.901
+0.009
1.0%
jan 1, 1991
0.933
+0.032
3.59%
jan 1, 1992
0.959
+0.025
2.71%
jan 1, 1993
0.979
+0.02
2.13%
jan 1, 1994
1.012
+0.033
3.34%
jan 1, 1995
1.029
+0.017
1.7%
jan 1, 1996
1.064
+0.035
3.41%
jan 1, 1997
1.041
-0.023
-2.14%
jan 1, 1998
1.092
+0.051
4.9%
jan 1, 1999
1.126
+0.034
3.15%
jan 1, 2000
1.148
+0.022
1.95%
jan 1, 2001
1.184
+0.035
3.08%
jan 1, 2002
1.217
+0.033
2.79%
jan 1, 2003
1.26
+0.043
3.56%
jan 1, 2004
1.303
+0.043
3.4%
jan 1, 2005
1.373
+0.07
5.4%
jan 1, 2006
1.39
+0.017
1.22%
jan 1, 2007
1.406
+0.016
1.12%
jan 1, 2008
1.399
-0.007
-0.49%
jan 1, 2009
1.396
-0.003
-0.21%
jan 1, 2010
1.378
-0.017
-1.25%
jan 1, 2011
1.351
-0.027
-1.99%
jan 1, 2012
1.333
-0.018
-1.36%
jan 1, 2013
1.325
-0.007
-0.55%
jan 1, 2014
1.313
-0.012
-0.91%
jan 1, 2015
1.307
-0.006
-0.44%
Ranking of countries by current statistics by years


Comments: