29
/
en
AIzaSyAYiBZKx7MnpbEhh9jyipgxe19OcubqV5w
April 1, 2024
117397
Cyprus
CYP
true
2
1
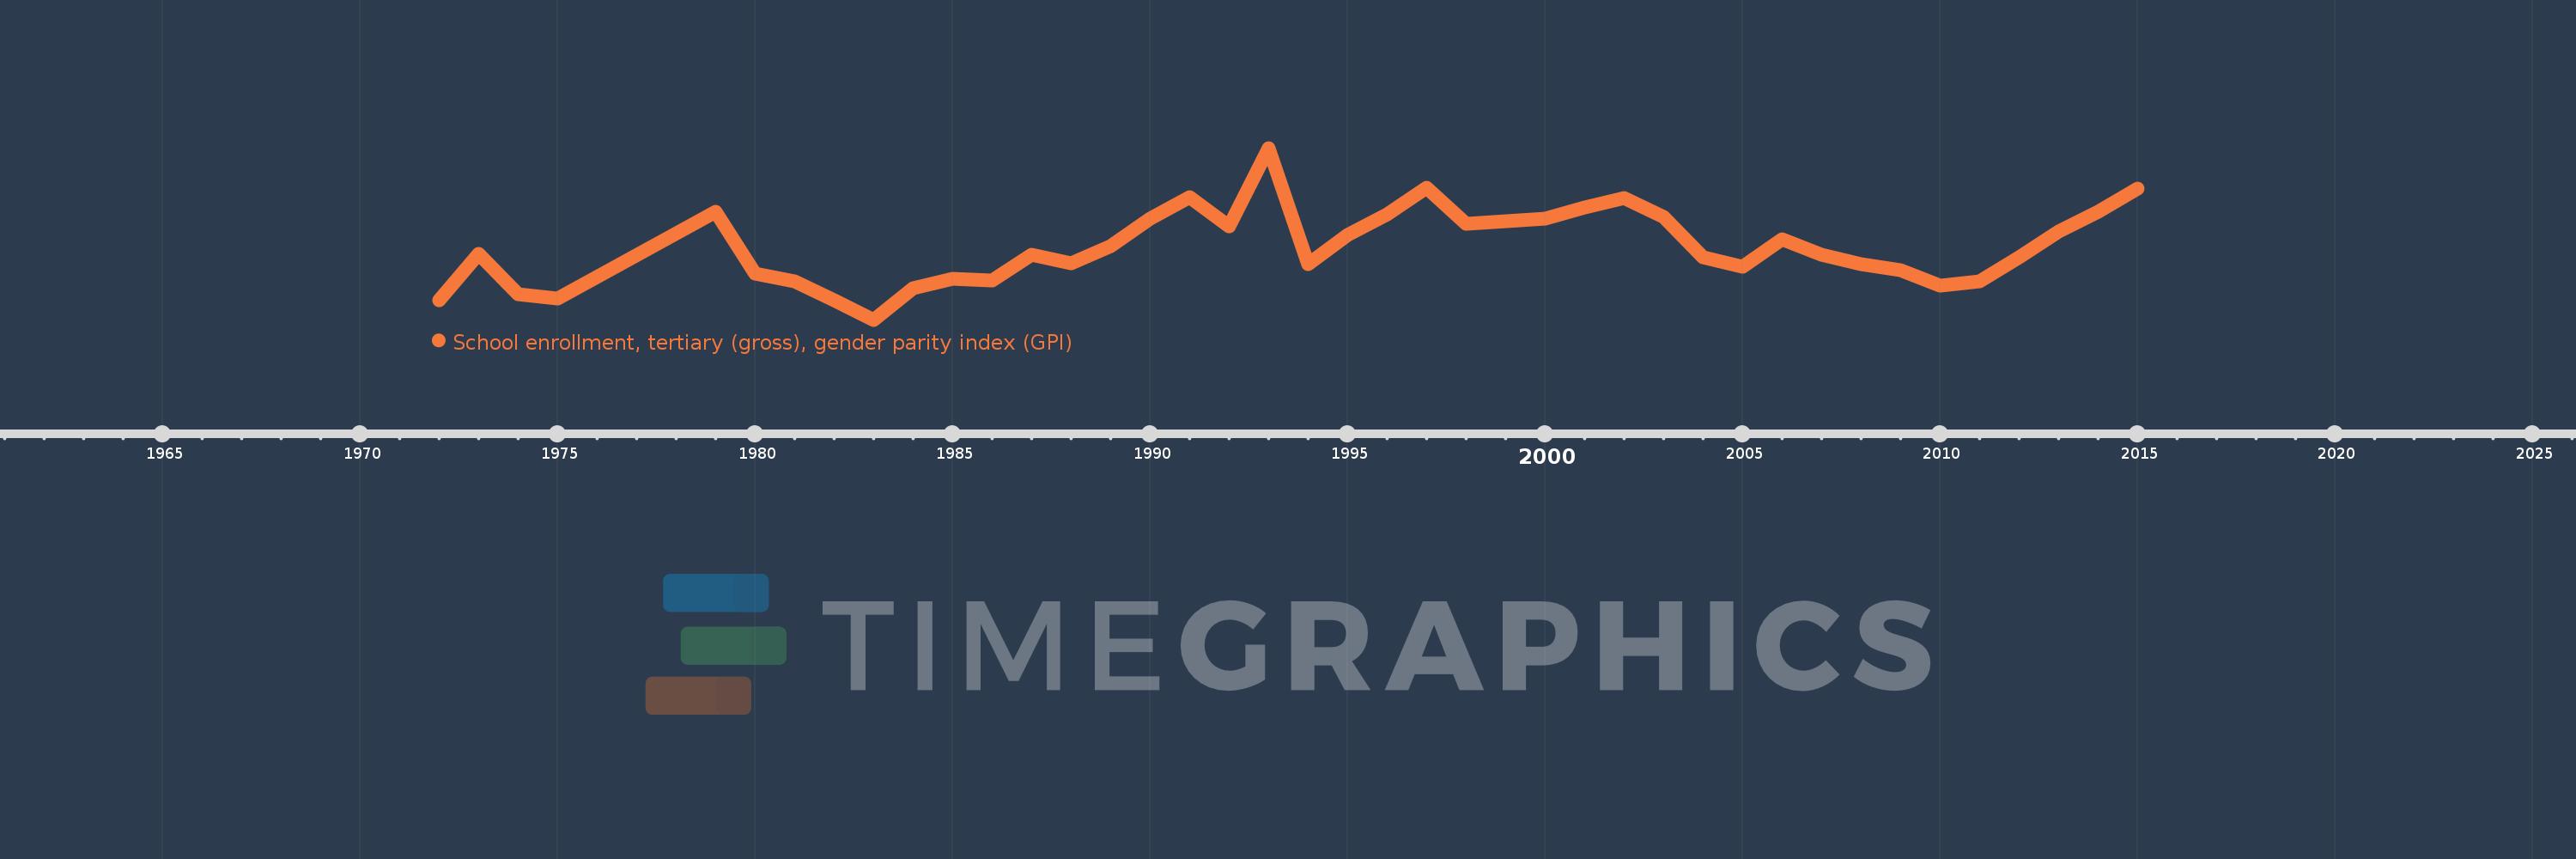
School enrollment, tertiary (gross), gender parity index (GPI)
2015,2014,2013,2012,2011,2010,2009,2008,2007,2006,2005,2004,2003,2002,2001,2000,1998,1997,1996,1995,1994,1993,1992,1991,1990,1989,1988,1987,1986,1985,1984,1983,1982,1981,1980,1979,1975,1974,1973,1972
This statistics in other country:
AfghanistanAlbaniaAlgeriaAngolaAntigua and BarbudaArab WorldArgentinaArmeniaArubaAustraliaAustriaAzerbaijanBahamas, TheBahrainBangladeshBarbadosBelarusBelgiumBelizeBeninBermudaBhutanBoliviaBosnia and HerzegovinaBotswanaBrazilBrunei DarussalamBulgariaBurkina FasoBurundiCabo VerdeCambodiaCameroonCanadaCaribbean small statesCentral African RepublicCentral Europe and the BalticsChadChileChinaColombiaComorosCongo, Dem. Rep.Congo, Rep.Costa RicaCote d'IvoireCroatiaCubaCuracaoCyprusCzech RepublicDenmarkDjiboutiDominicaDominican RepublicEarly-demographic dividendEast Asia & PacificEast Asia & Pacific (excluding high income)East Asia & Pacific (IDA & IBRD countries)EcuadorEgypt, Arab Rep.El SalvadorEquatorial GuineaEritreaEstoniaEthiopiaEuro areaEurope & Central AsiaEurope & Central Asia (excluding high income)Europe & Central Asia (IDA & IBRD countries)European UnionFijiFinlandFragile and conflict affected situationsFranceGabonGambia, TheGeorgiaGermanyGhanaGreeceGrenadaGuatemalaGuineaGuinea-BissauGuyanaHaitiHeavily indebted poor countries (HIPC)High incomeHondurasHong Kong SAR, ChinaHungaryIBRD onlyIcelandIDA & IBRD totalIDA blendIDA onlyIDA totalIndiaIndonesiaIran, Islamic Rep.IraqIrelandIsraelItalyJamaicaJapanJordanKazakhstanKenyaKorea, Dem. People’s Rep.Korea, Rep.KuwaitKyrgyz RepublicLao PDRLate-demographic dividendLatin America & Caribbean Latin America & Caribbean (excluding high income)Latin America & the Caribbean (IDA & IBRD countries)LatviaLeast developed countries: UN classificationLebanonLesothoLiberiaLibyaLiechtensteinLithuaniaLow & middle incomeLow incomeLower middle incomeLuxembourgMacao SAR, ChinaMacedonia, FYRMadagascarMalawiMaldivesMaliMaltaMarshall IslandsMauritaniaMauritiusMexicoMicronesia, Fed. Sts.Middle East & North AfricaMiddle East & North Africa (excluding high income)Middle East & North Africa (IDA & IBRD countries)Middle incomeMoldovaMongoliaMontenegroMoroccoMozambiqueMyanmarNamibiaNepalNetherlandsNew ZealandNicaraguaNigerNigeriaNorth AmericaNorwayOECD membersOmanOther small statesPacific island small statesPakistanPalauPanamaPapua New GuineaParaguayPeruPhilippinesPolandPortugalPost-demographic dividendPre-demographic dividendPuerto RicoQatarRomaniaRussian FederationRwandaSamoaSan MarinoSao Tome and PrincipeSaudi ArabiaSenegalSerbiaSeychellesSierra LeoneSingaporeSlovak RepublicSloveniaSmall statesSomaliaSouth AfricaSouth AsiaSouth Asia (IDA & IBRD)SpainSri LankaSt. Kitts and NevisSt. LuciaSt. Vincent and the GrenadinesSub-Saharan Africa Sub-Saharan Africa (excluding high income)Sub-Saharan Africa (IDA & IBRD countries)SudanSurinameSwazilandSwedenSwitzerlandSyrian Arab RepublicTajikistanTanzaniaThailandTimor-LesteTogoTongaTrinidad and TobagoTunisiaTurkeyTurkmenistanUgandaUkraineUnited Arab EmiratesUnited KingdomUnited StatesUpper middle incomeUruguayUzbekistanVanuatuVenezuela, RBVietnamWest Bank and GazaWorldYemen, Rep.ZambiaZimbabwe Timeline:
This timeline shows a graph from 1972 to 2015 of Cyprus. No data until 1971. Number of actual observations by date: 40.
Source name:
World Development Indicators
Source organization:
United Nations Educational, Scientific, and Cultural Organization (UNESCO) Institute for Statistics.
Categories, topics:
Education, Gender, Social Development
Last updated:
apr 23, 2017
Indicators value changes by year
At the date of observation
Value
Absolute change
Change from previous value
jan 1, 1972
0.793
+0.793
0.0%
jan 1, 1973
1.05
+0.257
32.47%
jan 1, 1974
0.823
-0.227
-21.63%
jan 1, 1975
0.8
-0.022
-2.72%
jan 1, 1979
1.29
+0.49
61.17%
jan 1, 1980
0.943
-0.347
-26.93%
jan 1, 1981
0.897
-0.045
-4.81%
jan 1, 1982
0.792
-0.106
-11.79%
jan 1, 1983
0.681
-0.111
-13.99%
jan 1, 1984
0.86
+0.179
26.25%
jan 1, 1985
0.912
+0.052
6.06%
jan 1, 1986
0.9
-0.012
-1.29%
jan 1, 1987
1.045
+0.145
16.08%
jan 1, 1988
1.001
-0.044
-4.17%
jan 1, 1989
1.096
+0.095
9.48%
jan 1, 1990
1.25
+0.154
14.1%
jan 1, 1991
1.371
+0.121
9.64%
jan 1, 1992
1.208
-0.163
-11.87%
jan 1, 1993
1.648
+0.439
36.38%
jan 1, 1994
0.995
-0.652
-39.59%
jan 1, 1995
1.158
+0.163
16.35%
jan 1, 1996
1.274
+0.116
10.05%
jan 1, 1997
1.425
+0.15
11.77%
jan 1, 1998
1.223
-0.202
-14.18%
jan 1, 2000
1.248
+0.026
2.11%
jan 1, 2001
1.314
+0.066
5.3%
jan 1, 2002
1.365
+0.051
3.85%
jan 1, 2003
1.259
-0.106
-7.79%
jan 1, 2004
1.034
-0.225
-17.87%
jan 1, 2005
0.98
-0.053
-5.17%
jan 1, 2006
1.132
+0.152
15.52%
jan 1, 2007
1.048
-0.085
-7.47%
jan 1, 2008
0.994
-0.054
-5.15%
jan 1, 2009
0.958
-0.036
-3.58%
jan 1, 2010
0.872
-0.086
-9.01%
jan 1, 2011
0.897
+0.025
2.87%
jan 1, 2012
1.032
+0.136
15.11%
jan 1, 2013
1.179
+0.147
14.2%
jan 1, 2014
1.291
+0.112
9.46%
jan 1, 2015
1.419
+0.129
9.98%
Ranking of countries by current statistics by years


Comments: