29
/
en
AIzaSyAYiBZKx7MnpbEhh9jyipgxe19OcubqV5w
April 1, 2024
258962
Syrian Arab Republic
SYR
true
2
1
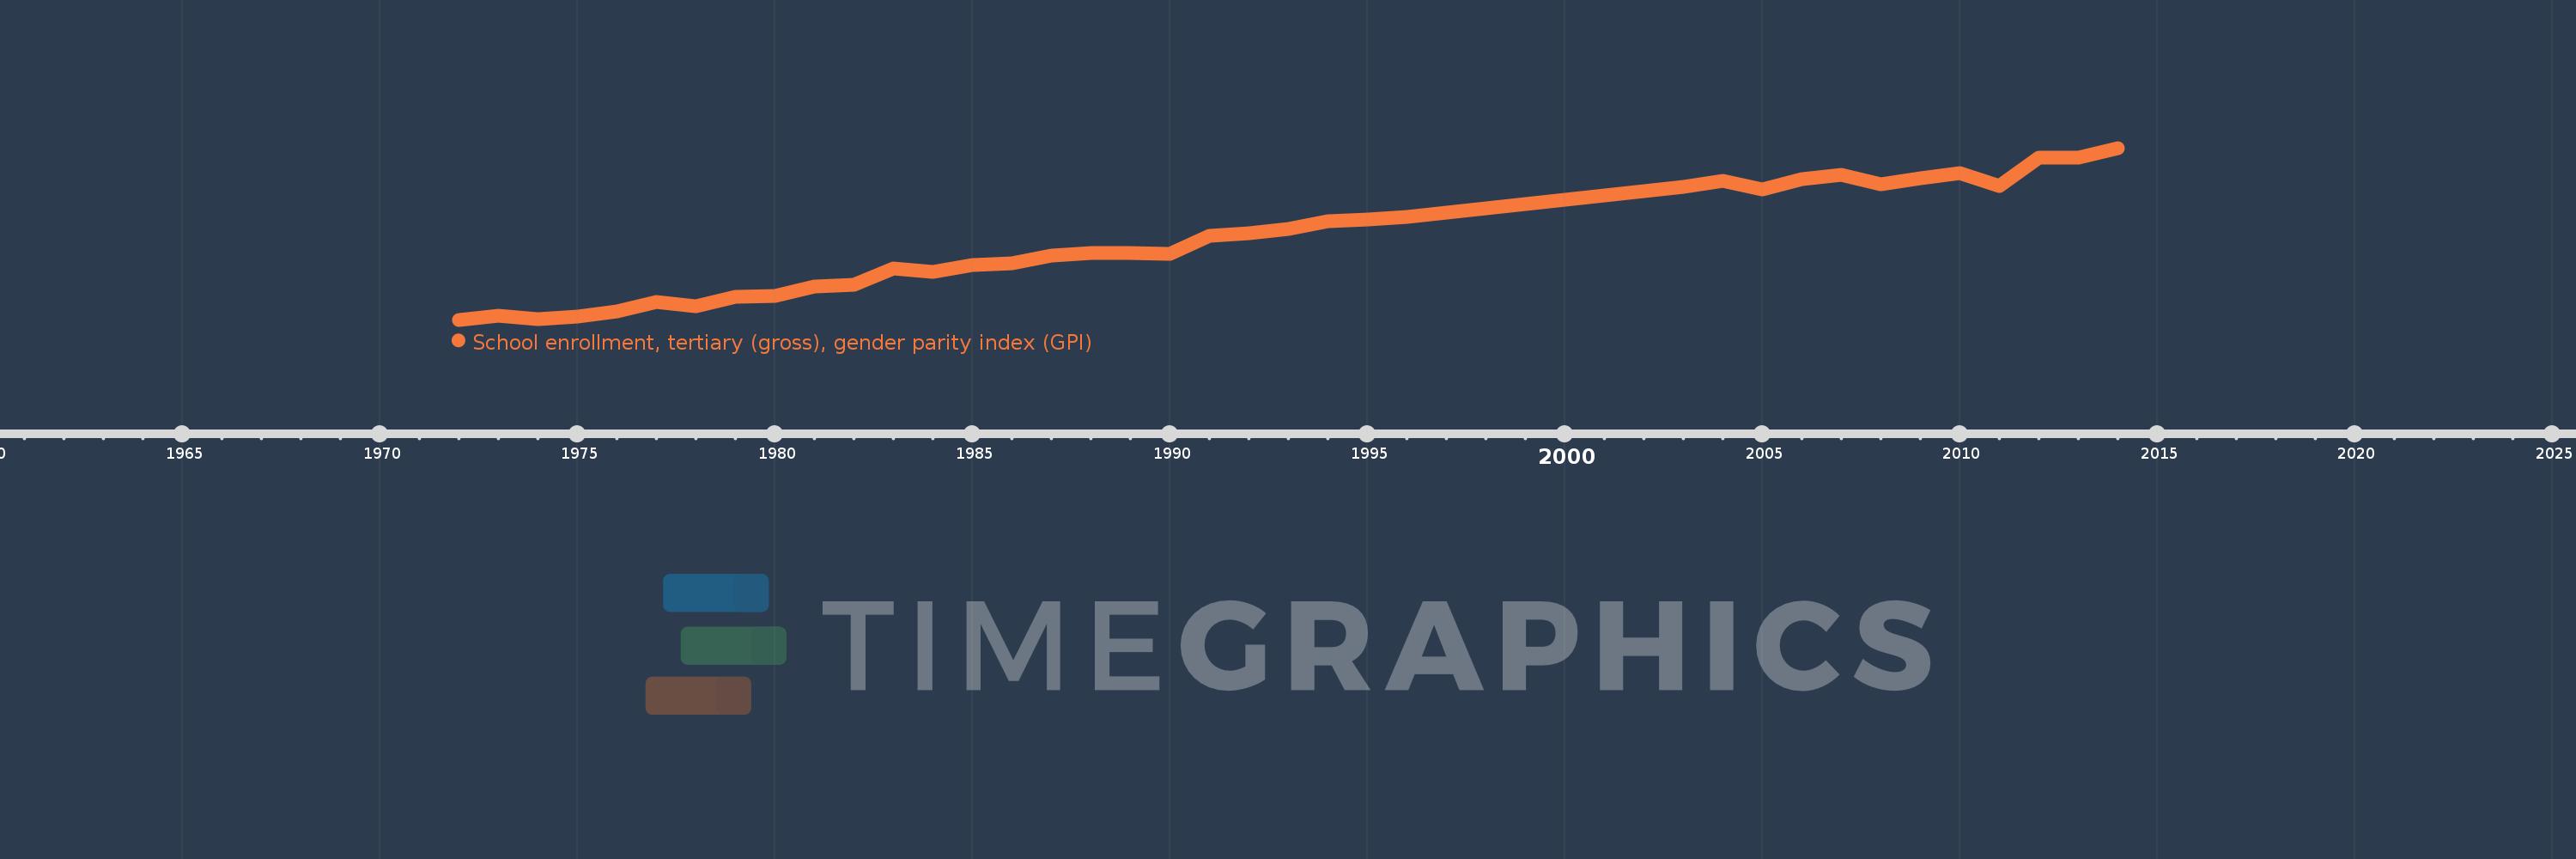
School enrollment, tertiary (gross), gender parity index (GPI)
2014,2013,2012,2011,2010,2009,2008,2007,2006,2005,2004,2003,1996,1995,1994,1993,1992,1991,1990,1989,1988,1987,1986,1985,1984,1983,1982,1981,1980,1979,1978,1977,1976,1975,1974,1973,1972
This statistics in other country:
AfghanistanAlbaniaAlgeriaAngolaAntigua and BarbudaArab WorldArgentinaArmeniaArubaAustraliaAustriaAzerbaijanBahamas, TheBahrainBangladeshBarbadosBelarusBelgiumBelizeBeninBermudaBhutanBoliviaBosnia and HerzegovinaBotswanaBrazilBrunei DarussalamBulgariaBurkina FasoBurundiCabo VerdeCambodiaCameroonCanadaCaribbean small statesCentral African RepublicCentral Europe and the BalticsChadChileChinaColombiaComorosCongo, Dem. Rep.Congo, Rep.Costa RicaCote d'IvoireCroatiaCubaCuracaoCyprusCzech RepublicDenmarkDjiboutiDominicaDominican RepublicEarly-demographic dividendEast Asia & PacificEast Asia & Pacific (excluding high income)East Asia & Pacific (IDA & IBRD countries)EcuadorEgypt, Arab Rep.El SalvadorEquatorial GuineaEritreaEstoniaEthiopiaEuro areaEurope & Central AsiaEurope & Central Asia (excluding high income)Europe & Central Asia (IDA & IBRD countries)European UnionFijiFinlandFragile and conflict affected situationsFranceGabonGambia, TheGeorgiaGermanyGhanaGreeceGrenadaGuatemalaGuineaGuinea-BissauGuyanaHaitiHeavily indebted poor countries (HIPC)High incomeHondurasHong Kong SAR, ChinaHungaryIBRD onlyIcelandIDA & IBRD totalIDA blendIDA onlyIDA totalIndiaIndonesiaIran, Islamic Rep.IraqIrelandIsraelItalyJamaicaJapanJordanKazakhstanKenyaKorea, Dem. People’s Rep.Korea, Rep.KuwaitKyrgyz RepublicLao PDRLate-demographic dividendLatin America & Caribbean Latin America & Caribbean (excluding high income)Latin America & the Caribbean (IDA & IBRD countries)LatviaLeast developed countries: UN classificationLebanonLesothoLiberiaLibyaLiechtensteinLithuaniaLow & middle incomeLow incomeLower middle incomeLuxembourgMacao SAR, ChinaMacedonia, FYRMadagascarMalawiMaldivesMaliMaltaMarshall IslandsMauritaniaMauritiusMexicoMicronesia, Fed. Sts.Middle East & North AfricaMiddle East & North Africa (excluding high income)Middle East & North Africa (IDA & IBRD countries)Middle incomeMoldovaMongoliaMontenegroMoroccoMozambiqueMyanmarNamibiaNepalNetherlandsNew ZealandNicaraguaNigerNigeriaNorth AmericaNorwayOECD membersOmanOther small statesPacific island small statesPakistanPalauPanamaPapua New GuineaParaguayPeruPhilippinesPolandPortugalPost-demographic dividendPre-demographic dividendPuerto RicoQatarRomaniaRussian FederationRwandaSamoaSan MarinoSao Tome and PrincipeSaudi ArabiaSenegalSerbiaSeychellesSierra LeoneSingaporeSlovak RepublicSloveniaSmall statesSomaliaSouth AfricaSouth AsiaSouth Asia (IDA & IBRD)SpainSri LankaSt. Kitts and NevisSt. LuciaSt. Vincent and the GrenadinesSub-Saharan Africa Sub-Saharan Africa (excluding high income)Sub-Saharan Africa (IDA & IBRD countries)SudanSurinameSwazilandSwedenSwitzerlandSyrian Arab RepublicTajikistanTanzaniaThailandTimor-LesteTogoTongaTrinidad and TobagoTunisiaTurkeyTurkmenistanUgandaUkraineUnited Arab EmiratesUnited KingdomUnited StatesUpper middle incomeUruguayUzbekistanVanuatuVenezuela, RBVietnamWest Bank and GazaWorldYemen, Rep.ZambiaZimbabwe Timeline:
This timeline shows a graph from 1972 to 2014 of Syrian Arab Republic. No data until 1971. Number of actual observations by date: 37.
Source name:
World Development Indicators
Source organization:
United Nations Educational, Scientific, and Cultural Organization (UNESCO) Institute for Statistics.
Categories, topics:
Education, Gender, Social Development
Last updated:
apr 23, 2017
Indicators value changes by year
At the date of observation
Value
Absolute change
Change from previous value
jan 1, 1972
0.265
+0.265
0.0%
jan 1, 1973
0.283
+0.019
7.02%
jan 1, 1974
0.267
-0.016
-5.72%
jan 1, 1975
0.28
+0.013
4.78%
jan 1, 1976
0.304
+0.024
8.48%
jan 1, 1977
0.343
+0.04
13.09%
jan 1, 1978
0.326
-0.017
-5.08%
jan 1, 1979
0.367
+0.041
12.55%
jan 1, 1980
0.373
+0.006
1.75%
jan 1, 1981
0.413
+0.04
10.72%
jan 1, 1982
0.422
+0.009
2.15%
jan 1, 1983
0.494
+0.071
16.93%
jan 1, 1984
0.48
-0.014
-2.82%
jan 1, 1985
0.509
+0.03
6.24%
jan 1, 1986
0.518
+0.008
1.59%
jan 1, 1987
0.551
+0.034
6.52%
jan 1, 1988
0.565
+0.014
2.54%
jan 1, 1989
0.563
-0.002
-0.38%
jan 1, 1990
0.562
-0.001
-0.2%
jan 1, 1991
0.641
+0.079
14.03%
jan 1, 1992
0.652
+0.011
1.69%
jan 1, 1993
0.673
+0.021
3.19%
jan 1, 1994
0.708
+0.036
5.33%
jan 1, 1995
0.716
+0.008
1.07%
jan 1, 1996
0.724
+0.008
1.18%
jan 1, 2003
0.859
+0.135
18.57%
jan 1, 2004
0.887
+0.028
3.27%
jan 1, 2005
0.848
-0.039
-4.37%
jan 1, 2006
0.895
+0.047
5.53%
jan 1, 2007
0.915
+0.02
2.26%
jan 1, 2008
0.874
-0.042
-4.56%
jan 1, 2009
0.899
+0.025
2.87%
jan 1, 2010
0.922
+0.024
2.64%
jan 1, 2011
0.864
-0.059
-6.36%
jan 1, 2012
0.991
+0.127
14.7%
jan 1, 2013
0.99
-0.001
-0.07%
jan 1, 2014
1.035
+0.045
4.56%
Ranking of countries by current statistics by years


Comments: