29
/
en
AIzaSyAYiBZKx7MnpbEhh9jyipgxe19OcubqV5w
April 1, 2024
170476
Korea, Rep.
KOR
true
2
1
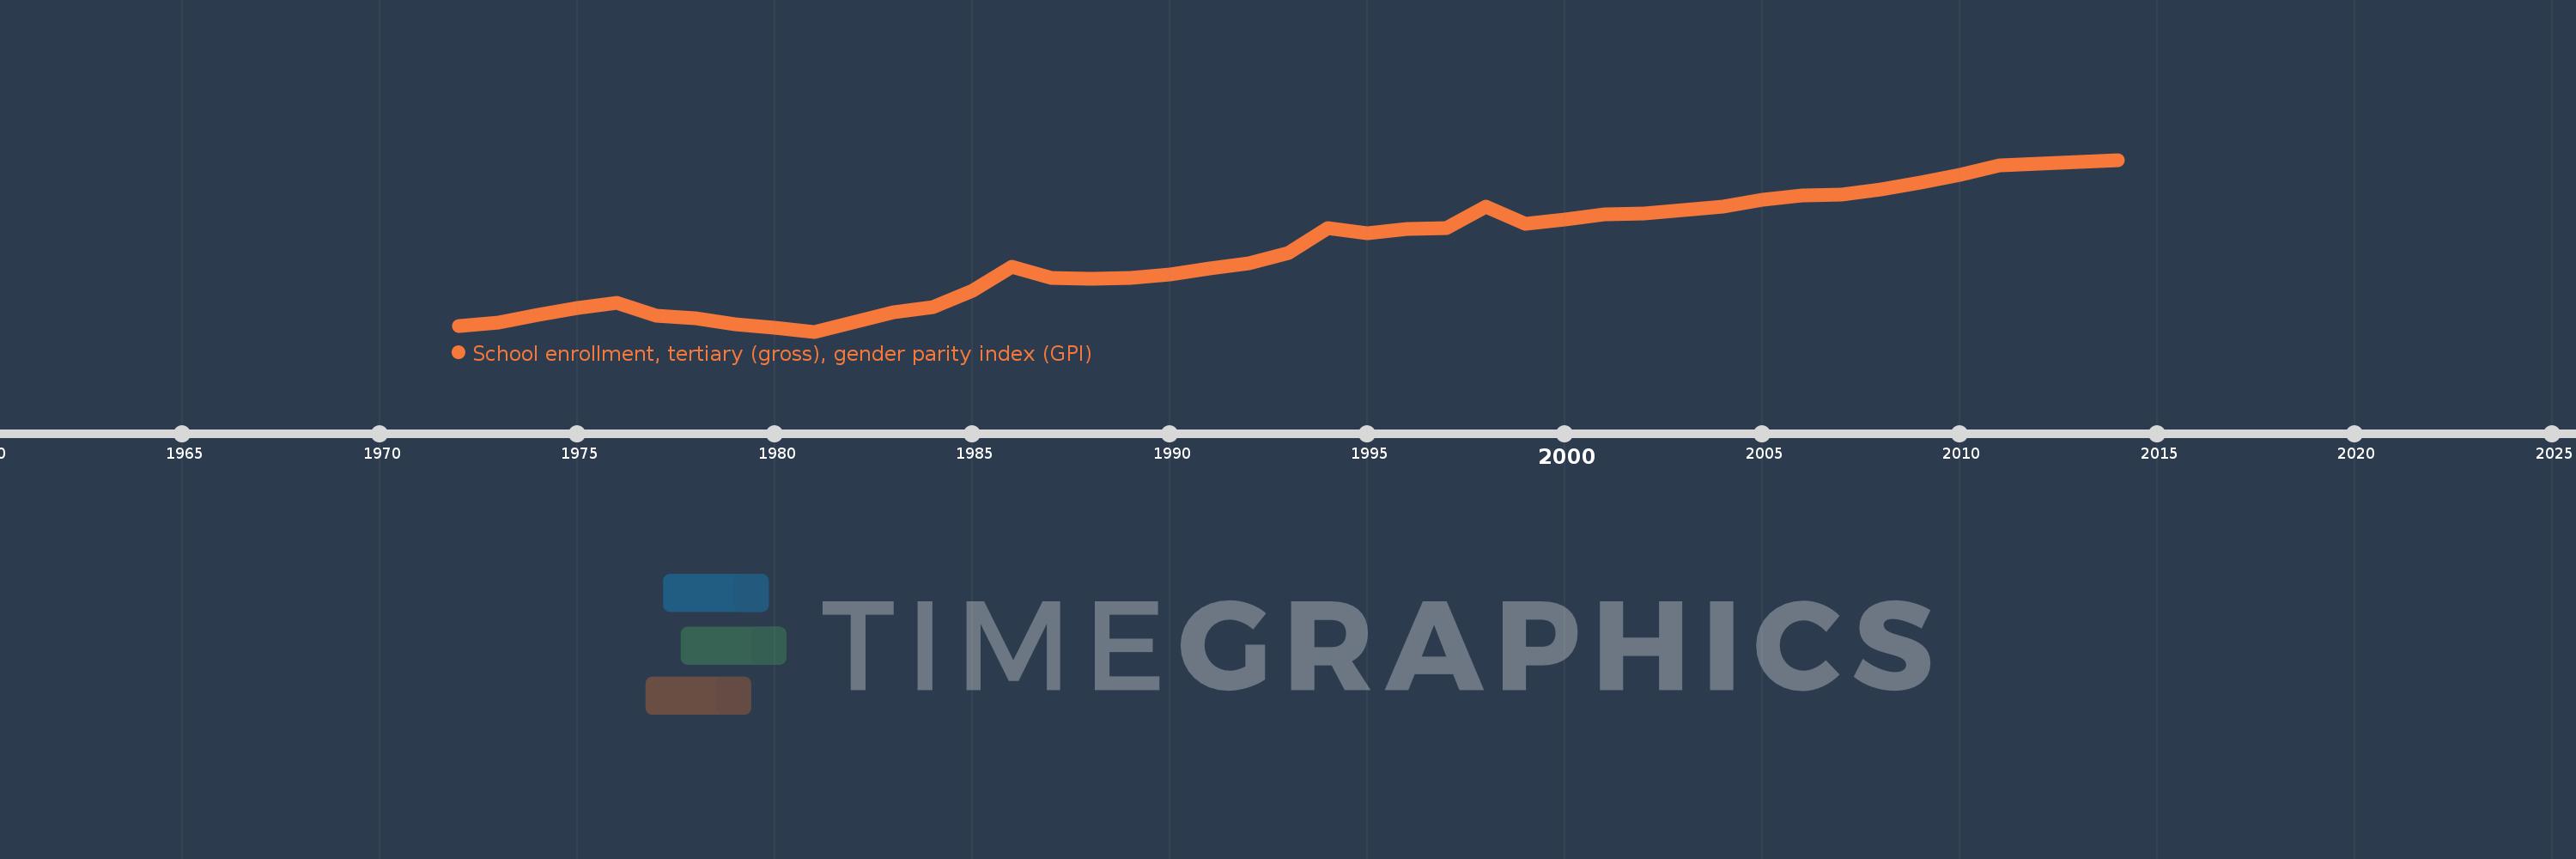
School enrollment, tertiary (gross), gender parity index (GPI)
2014,2013,2012,2011,2010,2009,2008,2007,2006,2005,2004,2003,2002,2001,2000,1999,1998,1997,1996,1995,1994,1993,1992,1991,1990,1989,1988,1987,1986,1985,1984,1983,1981,1980,1979,1978,1977,1976,1975,1974,1973,1972
This statistics in other country:
AfghanistanAlbaniaAlgeriaAngolaAntigua and BarbudaArab WorldArgentinaArmeniaArubaAustraliaAustriaAzerbaijanBahamas, TheBahrainBangladeshBarbadosBelarusBelgiumBelizeBeninBermudaBhutanBoliviaBosnia and HerzegovinaBotswanaBrazilBrunei DarussalamBulgariaBurkina FasoBurundiCabo VerdeCambodiaCameroonCanadaCaribbean small statesCentral African RepublicCentral Europe and the BalticsChadChileChinaColombiaComorosCongo, Dem. Rep.Congo, Rep.Costa RicaCote d'IvoireCroatiaCubaCuracaoCyprusCzech RepublicDenmarkDjiboutiDominicaDominican RepublicEarly-demographic dividendEast Asia & PacificEast Asia & Pacific (excluding high income)East Asia & Pacific (IDA & IBRD countries)EcuadorEgypt, Arab Rep.El SalvadorEquatorial GuineaEritreaEstoniaEthiopiaEuro areaEurope & Central AsiaEurope & Central Asia (excluding high income)Europe & Central Asia (IDA & IBRD countries)European UnionFijiFinlandFragile and conflict affected situationsFranceGabonGambia, TheGeorgiaGermanyGhanaGreeceGrenadaGuatemalaGuineaGuinea-BissauGuyanaHaitiHeavily indebted poor countries (HIPC)High incomeHondurasHong Kong SAR, ChinaHungaryIBRD onlyIcelandIDA & IBRD totalIDA blendIDA onlyIDA totalIndiaIndonesiaIran, Islamic Rep.IraqIrelandIsraelItalyJamaicaJapanJordanKazakhstanKenyaKorea, Dem. People’s Rep.Korea, Rep.KuwaitKyrgyz RepublicLao PDRLate-demographic dividendLatin America & Caribbean Latin America & Caribbean (excluding high income)Latin America & the Caribbean (IDA & IBRD countries)LatviaLeast developed countries: UN classificationLebanonLesothoLiberiaLibyaLiechtensteinLithuaniaLow & middle incomeLow incomeLower middle incomeLuxembourgMacao SAR, ChinaMacedonia, FYRMadagascarMalawiMaldivesMaliMaltaMarshall IslandsMauritaniaMauritiusMexicoMicronesia, Fed. Sts.Middle East & North AfricaMiddle East & North Africa (excluding high income)Middle East & North Africa (IDA & IBRD countries)Middle incomeMoldovaMongoliaMontenegroMoroccoMozambiqueMyanmarNamibiaNepalNetherlandsNew ZealandNicaraguaNigerNigeriaNorth AmericaNorwayOECD membersOmanOther small statesPacific island small statesPakistanPalauPanamaPapua New GuineaParaguayPeruPhilippinesPolandPortugalPost-demographic dividendPre-demographic dividendPuerto RicoQatarRomaniaRussian FederationRwandaSamoaSan MarinoSao Tome and PrincipeSaudi ArabiaSenegalSerbiaSeychellesSierra LeoneSingaporeSlovak RepublicSloveniaSmall statesSomaliaSouth AfricaSouth AsiaSouth Asia (IDA & IBRD)SpainSri LankaSt. Kitts and NevisSt. LuciaSt. Vincent and the GrenadinesSub-Saharan Africa Sub-Saharan Africa (excluding high income)Sub-Saharan Africa (IDA & IBRD countries)SudanSurinameSwazilandSwedenSwitzerlandSyrian Arab RepublicTajikistanTanzaniaThailandTimor-LesteTogoTongaTrinidad and TobagoTunisiaTurkeyTurkmenistanUgandaUkraineUnited Arab EmiratesUnited KingdomUnited StatesUpper middle incomeUruguayUzbekistanVanuatuVenezuela, RBVietnamWest Bank and GazaWorldYemen, Rep.ZambiaZimbabwe Timeline:
This timeline shows a graph from 1972 to 2014 of Korea, Rep.. No data until 1971. Number of actual observations by date: 42.
Source name:
World Development Indicators
Source organization:
United Nations Educational, Scientific, and Cultural Organization (UNESCO) Institute for Statistics.
Categories, topics:
Education, Gender, Social Development
Last updated:
apr 23, 2017
Indicators value changes by year
At the date of observation
Value
Absolute change
Change from previous value
jan 1, 1972
0.328
+0.328
0.0%
jan 1, 1973
0.337
+0.009
2.68%
jan 1, 1974
0.358
+0.021
6.27%
jan 1, 1975
0.374
+0.016
4.59%
jan 1, 1976
0.388
+0.014
3.71%
jan 1, 1977
0.355
-0.033
-8.54%
jan 1, 1978
0.348
-0.007
-2.0%
jan 1, 1979
0.333
-0.015
-4.32%
jan 1, 1980
0.324
-0.009
-2.78%
jan 1, 1981
0.314
-0.01
-3.08%
jan 1, 1983
0.363
+0.049
15.6%
jan 1, 1984
0.376
+0.013
3.7%
jan 1, 1985
0.418
+0.042
11.12%
jan 1, 1986
0.481
+0.063
15.17%
jan 1, 1987
0.451
-0.03
-6.27%
jan 1, 1988
0.45
-0.001
-0.29%
jan 1, 1989
0.451
+0.002
0.37%
jan 1, 1990
0.461
+0.01
2.19%
jan 1, 1991
0.476
+0.015
3.26%
jan 1, 1992
0.49
+0.014
2.9%
jan 1, 1993
0.516
+0.026
5.21%
jan 1, 1994
0.58
+0.064
12.4%
jan 1, 1995
0.565
-0.014
-2.44%
jan 1, 1996
0.577
+0.012
2.13%
jan 1, 1997
0.58
+0.002
0.39%
jan 1, 1998
0.634
+0.054
9.33%
jan 1, 1999
0.59
-0.044
-6.95%
jan 1, 2000
0.601
+0.011
1.92%
jan 1, 2001
0.614
+0.013
2.22%
jan 1, 2002
0.616
+0.002
0.31%
jan 1, 2003
0.625
+0.009
1.44%
jan 1, 2004
0.635
+0.01
1.6%
jan 1, 2005
0.651
+0.016
2.46%
jan 1, 2006
0.662
+0.011
1.63%
jan 1, 2007
0.666
+0.005
0.68%
jan 1, 2008
0.678
+0.012
1.82%
jan 1, 2009
0.696
+0.018
2.64%
jan 1, 2010
0.715
+0.019
2.77%
jan 1, 2011
0.739
+0.023
3.26%
jan 1, 2012
0.745
+0.007
0.91%
jan 1, 2013
0.749
+0.004
0.51%
jan 1, 2014
0.754
+0.005
0.6%
Ranking of countries by current statistics by years


Comments: