29
/
en
AIzaSyAYiBZKx7MnpbEhh9jyipgxe19OcubqV5w
April 1, 2024
73429
Australia
AUS
true
2
1
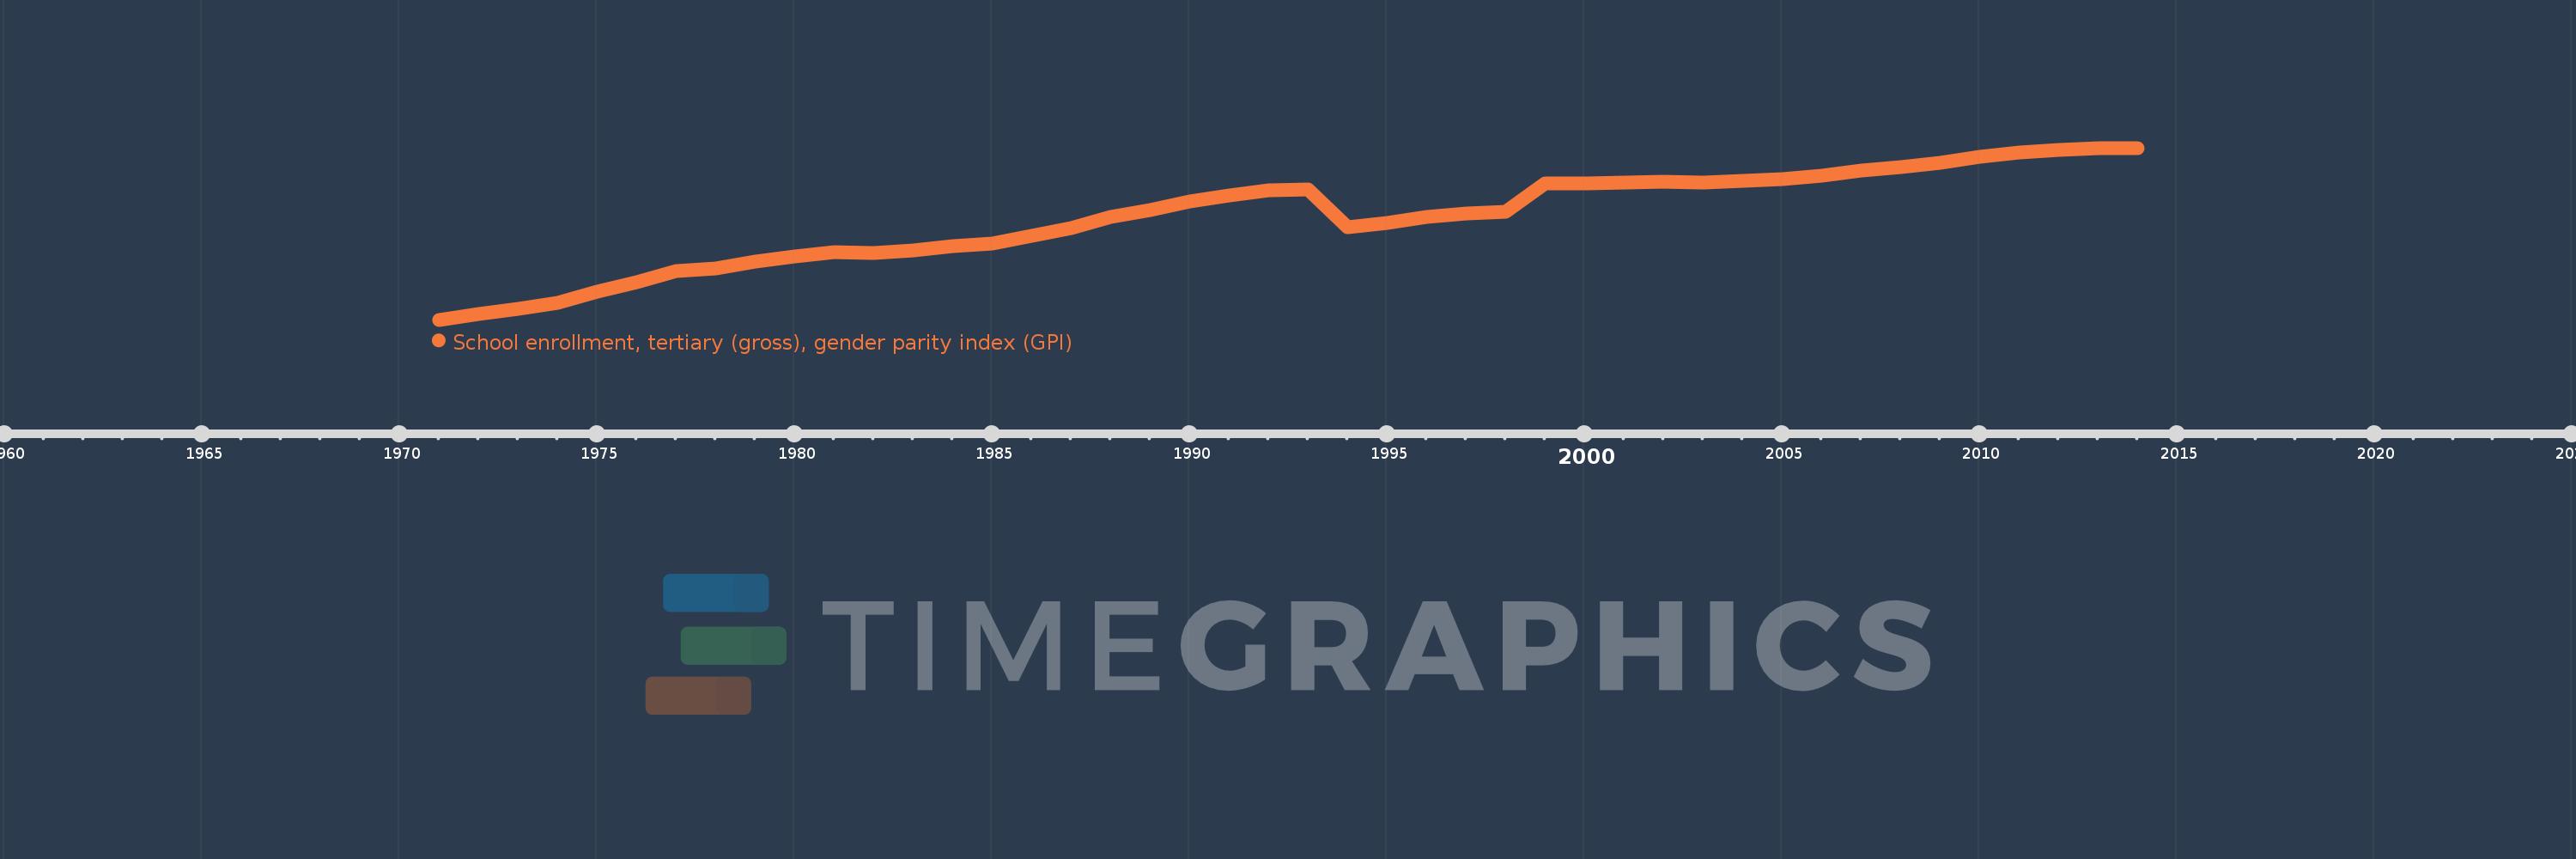
School enrollment, tertiary (gross), gender parity index (GPI)
2014,2013,2012,2011,2010,2009,2008,2007,2006,2005,2004,2003,2002,2001,2000,1999,1998,1997,1996,1995,1994,1993,1992,1991,1990,1989,1988,1987,1986,1985,1984,1983,1982,1981,1980,1979,1978,1977,1976,1975,1974,1973,1972,1971
This statistics in other country:
AfghanistanAlbaniaAlgeriaAngolaAntigua and BarbudaArab WorldArgentinaArmeniaArubaAustraliaAustriaAzerbaijanBahamas, TheBahrainBangladeshBarbadosBelarusBelgiumBelizeBeninBermudaBhutanBoliviaBosnia and HerzegovinaBotswanaBrazilBrunei DarussalamBulgariaBurkina FasoBurundiCabo VerdeCambodiaCameroonCanadaCaribbean small statesCentral African RepublicCentral Europe and the BalticsChadChileChinaColombiaComorosCongo, Dem. Rep.Congo, Rep.Costa RicaCote d'IvoireCroatiaCubaCuracaoCyprusCzech RepublicDenmarkDjiboutiDominicaDominican RepublicEarly-demographic dividendEast Asia & PacificEast Asia & Pacific (excluding high income)East Asia & Pacific (IDA & IBRD countries)EcuadorEgypt, Arab Rep.El SalvadorEquatorial GuineaEritreaEstoniaEthiopiaEuro areaEurope & Central AsiaEurope & Central Asia (excluding high income)Europe & Central Asia (IDA & IBRD countries)European UnionFijiFinlandFragile and conflict affected situationsFranceGabonGambia, TheGeorgiaGermanyGhanaGreeceGrenadaGuatemalaGuineaGuinea-BissauGuyanaHaitiHeavily indebted poor countries (HIPC)High incomeHondurasHong Kong SAR, ChinaHungaryIBRD onlyIcelandIDA & IBRD totalIDA blendIDA onlyIDA totalIndiaIndonesiaIran, Islamic Rep.IraqIrelandIsraelItalyJamaicaJapanJordanKazakhstanKenyaKorea, Dem. People’s Rep.Korea, Rep.KuwaitKyrgyz RepublicLao PDRLate-demographic dividendLatin America & Caribbean Latin America & Caribbean (excluding high income)Latin America & the Caribbean (IDA & IBRD countries)LatviaLeast developed countries: UN classificationLebanonLesothoLiberiaLibyaLiechtensteinLithuaniaLow & middle incomeLow incomeLower middle incomeLuxembourgMacao SAR, ChinaMacedonia, FYRMadagascarMalawiMaldivesMaliMaltaMarshall IslandsMauritaniaMauritiusMexicoMicronesia, Fed. Sts.Middle East & North AfricaMiddle East & North Africa (excluding high income)Middle East & North Africa (IDA & IBRD countries)Middle incomeMoldovaMongoliaMontenegroMoroccoMozambiqueMyanmarNamibiaNepalNetherlandsNew ZealandNicaraguaNigerNigeriaNorth AmericaNorwayOECD membersOmanOther small statesPacific island small statesPakistanPalauPanamaPapua New GuineaParaguayPeruPhilippinesPolandPortugalPost-demographic dividendPre-demographic dividendPuerto RicoQatarRomaniaRussian FederationRwandaSamoaSan MarinoSao Tome and PrincipeSaudi ArabiaSenegalSerbiaSeychellesSierra LeoneSingaporeSlovak RepublicSloveniaSmall statesSomaliaSouth AfricaSouth AsiaSouth Asia (IDA & IBRD)SpainSri LankaSt. Kitts and NevisSt. LuciaSt. Vincent and the GrenadinesSub-Saharan Africa Sub-Saharan Africa (excluding high income)Sub-Saharan Africa (IDA & IBRD countries)SudanSurinameSwazilandSwedenSwitzerlandSyrian Arab RepublicTajikistanTanzaniaThailandTimor-LesteTogoTongaTrinidad and TobagoTunisiaTurkeyTurkmenistanUgandaUkraineUnited Arab EmiratesUnited KingdomUnited StatesUpper middle incomeUruguayUzbekistanVanuatuVenezuela, RBVietnamWest Bank and GazaWorldYemen, Rep.ZambiaZimbabwe Timeline:
This timeline shows a graph from 1971 to 2014 of Australia. No data until 1970. Number of actual observations by date: 44.
Source name:
World Development Indicators
Source organization:
United Nations Educational, Scientific, and Cultural Organization (UNESCO) Institute for Statistics.
Categories, topics:
Education, Gender, Social Development
Last updated:
apr 23, 2017
Indicators value changes by year
At the date of observation
Value
Absolute change
Change from previous value
jan 1, 1971
0.504
+0.504
0.0%
jan 1, 1972
0.536
+0.032
6.3%
jan 1, 1973
0.56
+0.025
4.61%
jan 1, 1974
0.592
+0.031
5.61%
jan 1, 1975
0.652
+0.06
10.2%
jan 1, 1976
0.703
+0.051
7.75%
jan 1, 1977
0.761
+0.058
8.3%
jan 1, 1978
0.775
+0.014
1.84%
jan 1, 1979
0.808
+0.033
4.22%
jan 1, 1980
0.837
+0.029
3.57%
jan 1, 1981
0.857
+0.02
2.43%
jan 1, 1982
0.852
-0.005
-0.61%
jan 1, 1983
0.868
+0.016
1.93%
jan 1, 1984
0.891
+0.023
2.63%
jan 1, 1985
0.904
+0.012
1.39%
jan 1, 1986
0.945
+0.042
4.59%
jan 1, 1987
0.986
+0.041
4.35%
jan 1, 1988
1.041
+0.055
5.54%
jan 1, 1989
1.081
+0.04
3.84%
jan 1, 1990
1.125
+0.044
4.09%
jan 1, 1991
1.154
+0.029
2.58%
jan 1, 1992
1.182
+0.028
2.39%
jan 1, 1993
1.188
+0.006
0.52%
jan 1, 1994
0.989
-0.199
-16.76%
jan 1, 1995
1.01
+0.021
2.17%
jan 1, 1996
1.045
+0.035
3.43%
jan 1, 1997
1.062
+0.017
1.63%
jan 1, 1998
1.069
+0.008
0.71%
jan 1, 1999
1.218
+0.148
13.89%
jan 1, 2000
1.218
+0.0
0.01%
jan 1, 2001
1.225
+0.008
0.62%
jan 1, 2002
1.227
+0.001
0.09%
jan 1, 2003
1.222
-0.004
-0.35%
jan 1, 2004
1.234
+0.012
0.95%
jan 1, 2005
1.24
+0.006
0.5%
jan 1, 2006
1.259
+0.019
1.5%
jan 1, 2007
1.285
+0.026
2.09%
jan 1, 2008
1.303
+0.018
1.4%
jan 1, 2009
1.325
+0.022
1.69%
jan 1, 2010
1.358
+0.034
2.53%
jan 1, 2011
1.381
+0.023
1.66%
jan 1, 2012
1.394
+0.013
0.94%
jan 1, 2013
1.405
+0.011
0.81%
jan 1, 2014
1.403
-0.002
-0.15%
Ranking of countries by current statistics by years


Comments: