29
/
en
AIzaSyAYiBZKx7MnpbEhh9jyipgxe19OcubqV5w
April 1, 2024
191888
Malta
MLT
true
2
1
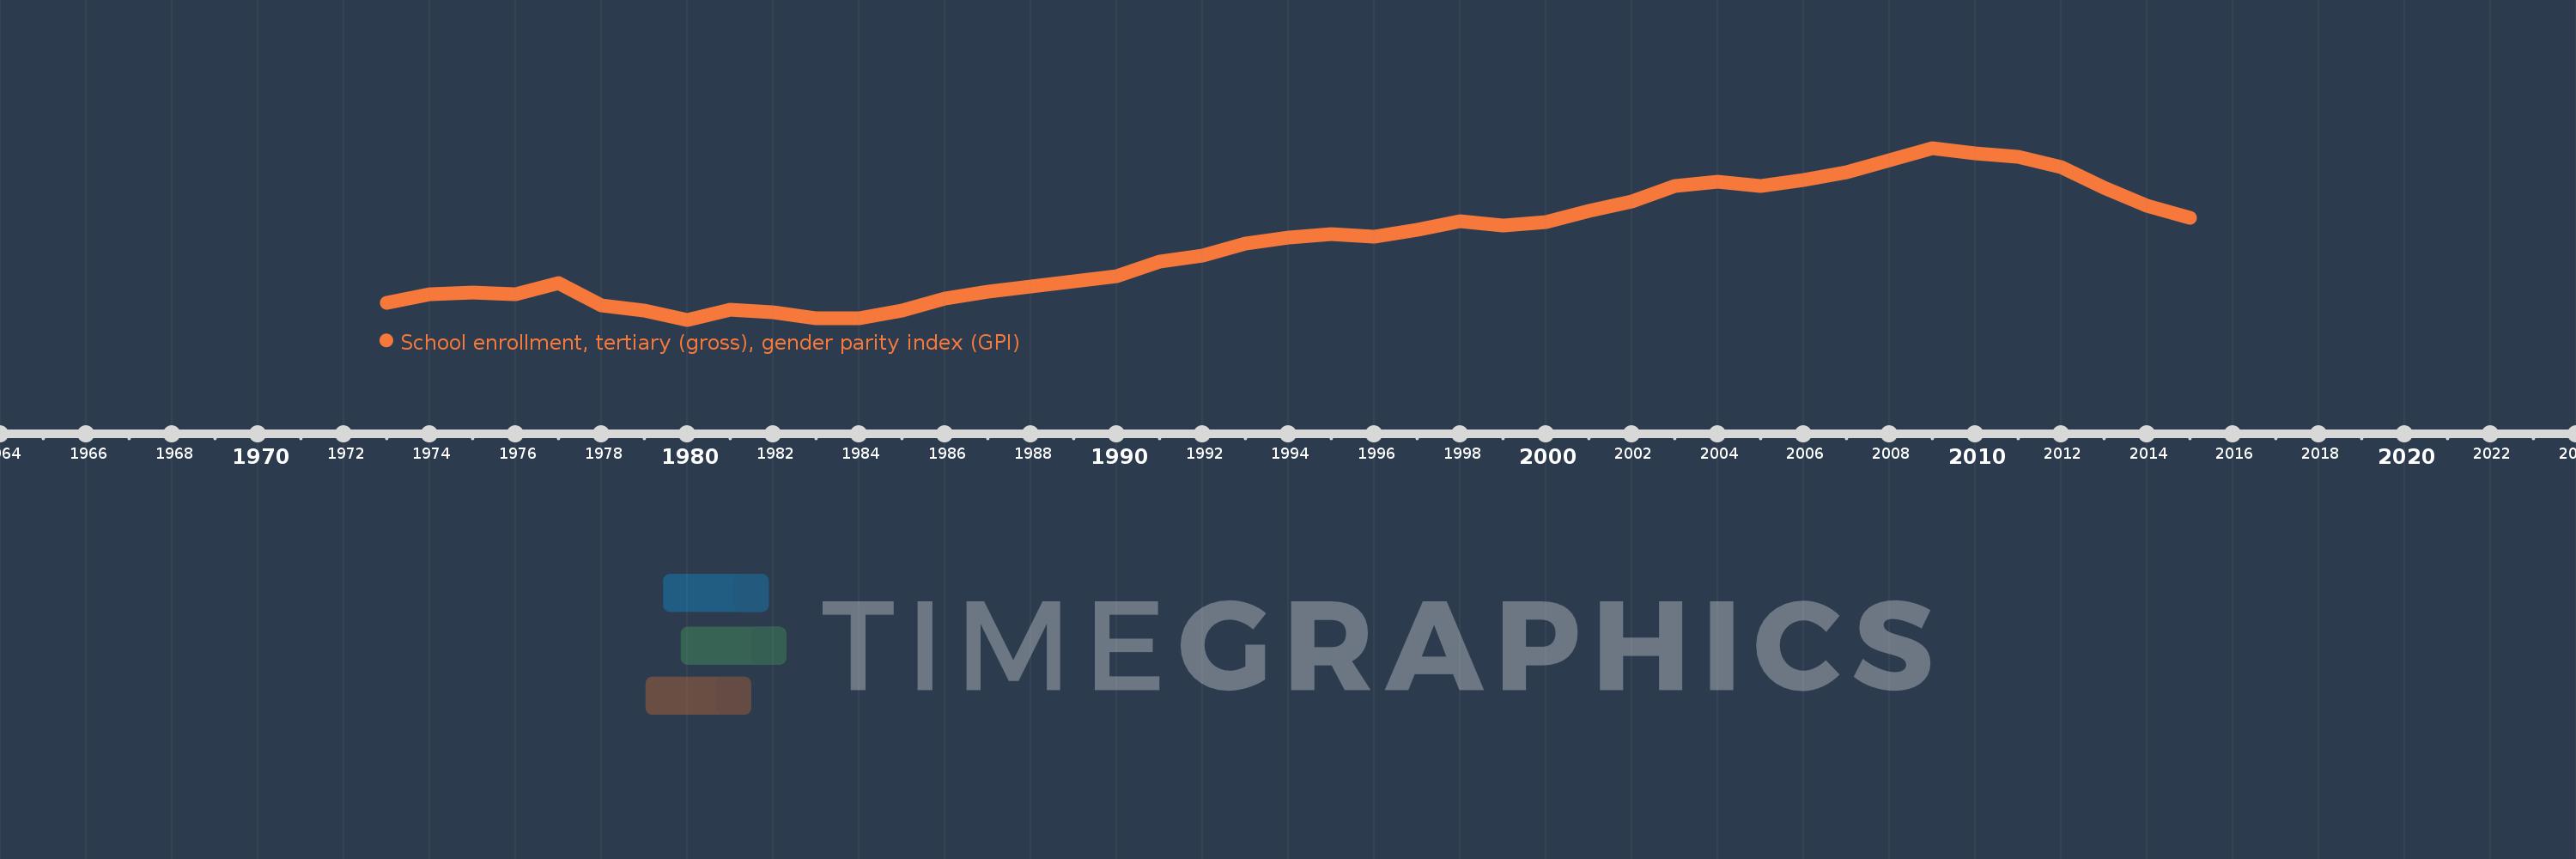
School enrollment, tertiary (gross), gender parity index (GPI)
2015,2014,2013,2012,2011,2010,2009,2008,2007,2006,2005,2004,2003,2002,2001,2000,1999,1998,1997,1996,1995,1994,1993,1992,1991,1990,1989,1988,1987,1986,1985,1984,1983,1982,1981,1980,1979,1978,1977,1976,1975,1974,1973
This statistics in other country:
AfghanistanAlbaniaAlgeriaAngolaAntigua and BarbudaArab WorldArgentinaArmeniaArubaAustraliaAustriaAzerbaijanBahamas, TheBahrainBangladeshBarbadosBelarusBelgiumBelizeBeninBermudaBhutanBoliviaBosnia and HerzegovinaBotswanaBrazilBrunei DarussalamBulgariaBurkina FasoBurundiCabo VerdeCambodiaCameroonCanadaCaribbean small statesCentral African RepublicCentral Europe and the BalticsChadChileChinaColombiaComorosCongo, Dem. Rep.Congo, Rep.Costa RicaCote d'IvoireCroatiaCubaCuracaoCyprusCzech RepublicDenmarkDjiboutiDominicaDominican RepublicEarly-demographic dividendEast Asia & PacificEast Asia & Pacific (excluding high income)East Asia & Pacific (IDA & IBRD countries)EcuadorEgypt, Arab Rep.El SalvadorEquatorial GuineaEritreaEstoniaEthiopiaEuro areaEurope & Central AsiaEurope & Central Asia (excluding high income)Europe & Central Asia (IDA & IBRD countries)European UnionFijiFinlandFragile and conflict affected situationsFranceGabonGambia, TheGeorgiaGermanyGhanaGreeceGrenadaGuatemalaGuineaGuinea-BissauGuyanaHaitiHeavily indebted poor countries (HIPC)High incomeHondurasHong Kong SAR, ChinaHungaryIBRD onlyIcelandIDA & IBRD totalIDA blendIDA onlyIDA totalIndiaIndonesiaIran, Islamic Rep.IraqIrelandIsraelItalyJamaicaJapanJordanKazakhstanKenyaKorea, Dem. People’s Rep.Korea, Rep.KuwaitKyrgyz RepublicLao PDRLate-demographic dividendLatin America & Caribbean Latin America & Caribbean (excluding high income)Latin America & the Caribbean (IDA & IBRD countries)LatviaLeast developed countries: UN classificationLebanonLesothoLiberiaLibyaLiechtensteinLithuaniaLow & middle incomeLow incomeLower middle incomeLuxembourgMacao SAR, ChinaMacedonia, FYRMadagascarMalawiMaldivesMaliMaltaMarshall IslandsMauritaniaMauritiusMexicoMicronesia, Fed. Sts.Middle East & North AfricaMiddle East & North Africa (excluding high income)Middle East & North Africa (IDA & IBRD countries)Middle incomeMoldovaMongoliaMontenegroMoroccoMozambiqueMyanmarNamibiaNepalNetherlandsNew ZealandNicaraguaNigerNigeriaNorth AmericaNorwayOECD membersOmanOther small statesPacific island small statesPakistanPalauPanamaPapua New GuineaParaguayPeruPhilippinesPolandPortugalPost-demographic dividendPre-demographic dividendPuerto RicoQatarRomaniaRussian FederationRwandaSamoaSan MarinoSao Tome and PrincipeSaudi ArabiaSenegalSerbiaSeychellesSierra LeoneSingaporeSlovak RepublicSloveniaSmall statesSomaliaSouth AfricaSouth AsiaSouth Asia (IDA & IBRD)SpainSri LankaSt. Kitts and NevisSt. LuciaSt. Vincent and the GrenadinesSub-Saharan Africa Sub-Saharan Africa (excluding high income)Sub-Saharan Africa (IDA & IBRD countries)SudanSurinameSwazilandSwedenSwitzerlandSyrian Arab RepublicTajikistanTanzaniaThailandTimor-LesteTogoTongaTrinidad and TobagoTunisiaTurkeyTurkmenistanUgandaUkraineUnited Arab EmiratesUnited KingdomUnited StatesUpper middle incomeUruguayUzbekistanVanuatuVenezuela, RBVietnamWest Bank and GazaWorldYemen, Rep.ZambiaZimbabwe Timeline:
This timeline shows a graph from 1973 to 2015 of Malta. No data until 1972. Number of actual observations by date: 43.
Source name:
World Development Indicators
Source organization:
United Nations Educational, Scientific, and Cultural Organization (UNESCO) Institute for Statistics.
Categories, topics:
Education, Gender, Social Development
Last updated:
apr 23, 2017
Indicators value changes by year
At the date of observation
Value
Absolute change
Change from previous value
jan 1, 1973
0.414
+0.414
0.0%
jan 1, 1974
0.488
+0.074
17.93%
jan 1, 1975
0.503
+0.015
3.0%
jan 1, 1976
0.488
-0.015
-3.0%
jan 1, 1977
0.586
+0.098
20.12%
jan 1, 1978
0.391
-0.195
-33.33%
jan 1, 1979
0.349
-0.042
-10.69%
jan 1, 1980
0.269
-0.08
-22.89%
jan 1, 1981
0.355
+0.086
31.99%
jan 1, 1982
0.331
-0.024
-6.69%
jan 1, 1983
0.278
-0.054
-16.19%
jan 1, 1984
0.285
+0.008
2.84%
jan 1, 1985
0.351
+0.066
23.01%
jan 1, 1986
0.451
+0.099
28.31%
jan 1, 1987
0.509
+0.058
12.97%
jan 1, 1988
0.552
+0.043
8.48%
jan 1, 1989
0.6
+0.048
8.66%
jan 1, 1990
0.645
+0.045
7.46%
jan 1, 1991
0.769
+0.124
19.23%
jan 1, 1992
0.82
+0.052
6.73%
jan 1, 1993
0.923
+0.103
12.55%
jan 1, 1994
0.976
+0.052
5.69%
jan 1, 1995
1.004
+0.028
2.88%
jan 1, 1996
0.98
-0.024
-2.39%
jan 1, 1997
1.043
+0.063
6.45%
jan 1, 1998
1.116
+0.073
7.0%
jan 1, 1999
1.078
-0.038
-3.4%
jan 1, 2000
1.111
+0.033
3.04%
jan 1, 2001
1.208
+0.097
8.73%
jan 1, 2002
1.283
+0.075
6.2%
jan 1, 2003
1.422
+0.139
10.86%
jan 1, 2004
1.453
+0.031
2.18%
jan 1, 2005
1.417
-0.036
-2.48%
jan 1, 2006
1.47
+0.052
3.69%
jan 1, 2007
1.535
+0.066
4.49%
jan 1, 2008
1.639
+0.103
6.73%
jan 1, 2009
1.747
+0.108
6.59%
jan 1, 2010
1.699
-0.048
-2.77%
jan 1, 2011
1.674
-0.025
-1.47%
jan 1, 2012
1.585
-0.088
-5.27%
jan 1, 2013
1.403
-0.182
-11.49%
jan 1, 2014
1.252
-0.151
-10.76%
jan 1, 2015
1.145
-0.107
-8.54%
Ranking of countries by current statistics by years


Comments: