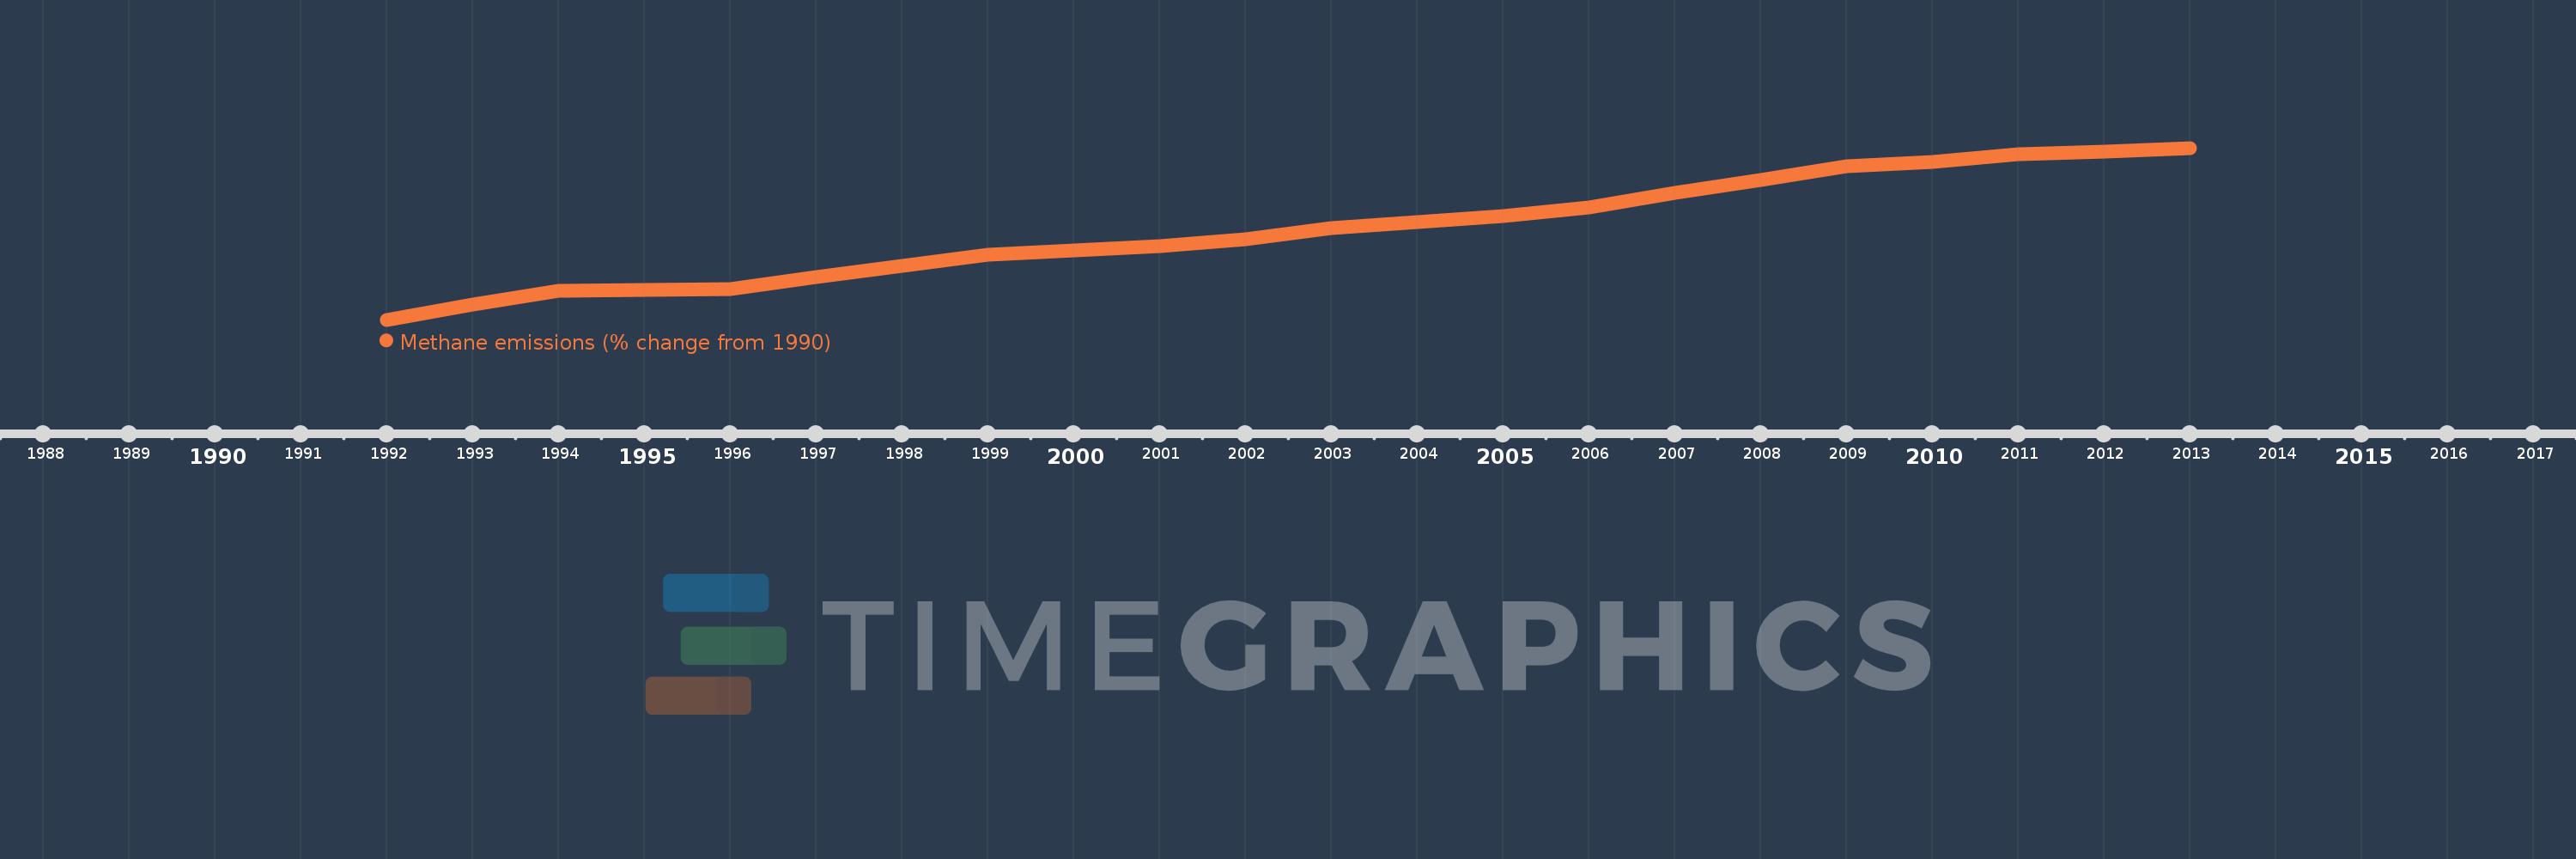
This timeline shows a graph from 1992 to 2013 of Bahrain. No data until 1991. Number of actual observations by date: 22.
Source name:
World Development Indicators
Source organization:
World Bank staff estimates from original source: European Commission, Joint Research Centre (JRC)/Netherlands Environmental Assessment Agency (PBL). Emission Database for Global Atmospheric Research (EDGAR): http://edgar.jrc.ec.europa.eu/.
Categories, topics:
Climate Change, Environment
Last updated:
apr 23, 2017
Indicators value changes by year
Meaning:
41.73
Minimum:
-8.819
jan 1, 1992
Maximum:
87.682
jan 1, 2013
At the date of observation
Value
Absolute change
Change from the previous value
jan 1, 1992
-8.819
-8.819
0.0%
jan 1, 1993
-0.085
+8.734
-99.04%
jan 1, 1994
7.379
+7.464
-8.78K%
jan 1, 1995
7.7
+0.321
4.35%
jan 1, 1996
8.418
+0.718
9.32%
jan 1, 1997
15.259
+6.841
81.27%
jan 1, 1998
21.347
+6.088
39.9%
jan 1, 1999
27.882
+6.536
30.62%
jan 1, 2000
30.203
+2.32
8.32%
jan 1, 2001
32.354
+2.152
7.12%
jan 1, 2002
36.527
+4.173
12.9%
jan 1, 2003
42.672
+6.145
16.82%
jan 1, 2004
45.968
+3.296
7.73%
jan 1, 2005
49.475
+3.507
7.63%
jan 1, 2006
54.403
+4.928
9.96%
jan 1, 2007
62.498
+8.095
14.88%
jan 1, 2008
69.899
+7.401
11.84%
jan 1, 2009
77.517
+7.618
10.9%
jan 1, 2010
79.944
+2.426
3.13%
jan 1, 2011
84.002
+4.059
5.08%
jan 1, 2012
85.842
+1.84
2.19%
jan 1, 2013
87.682
+1.84
2.14%
Ranking of countries by current statistics by years
