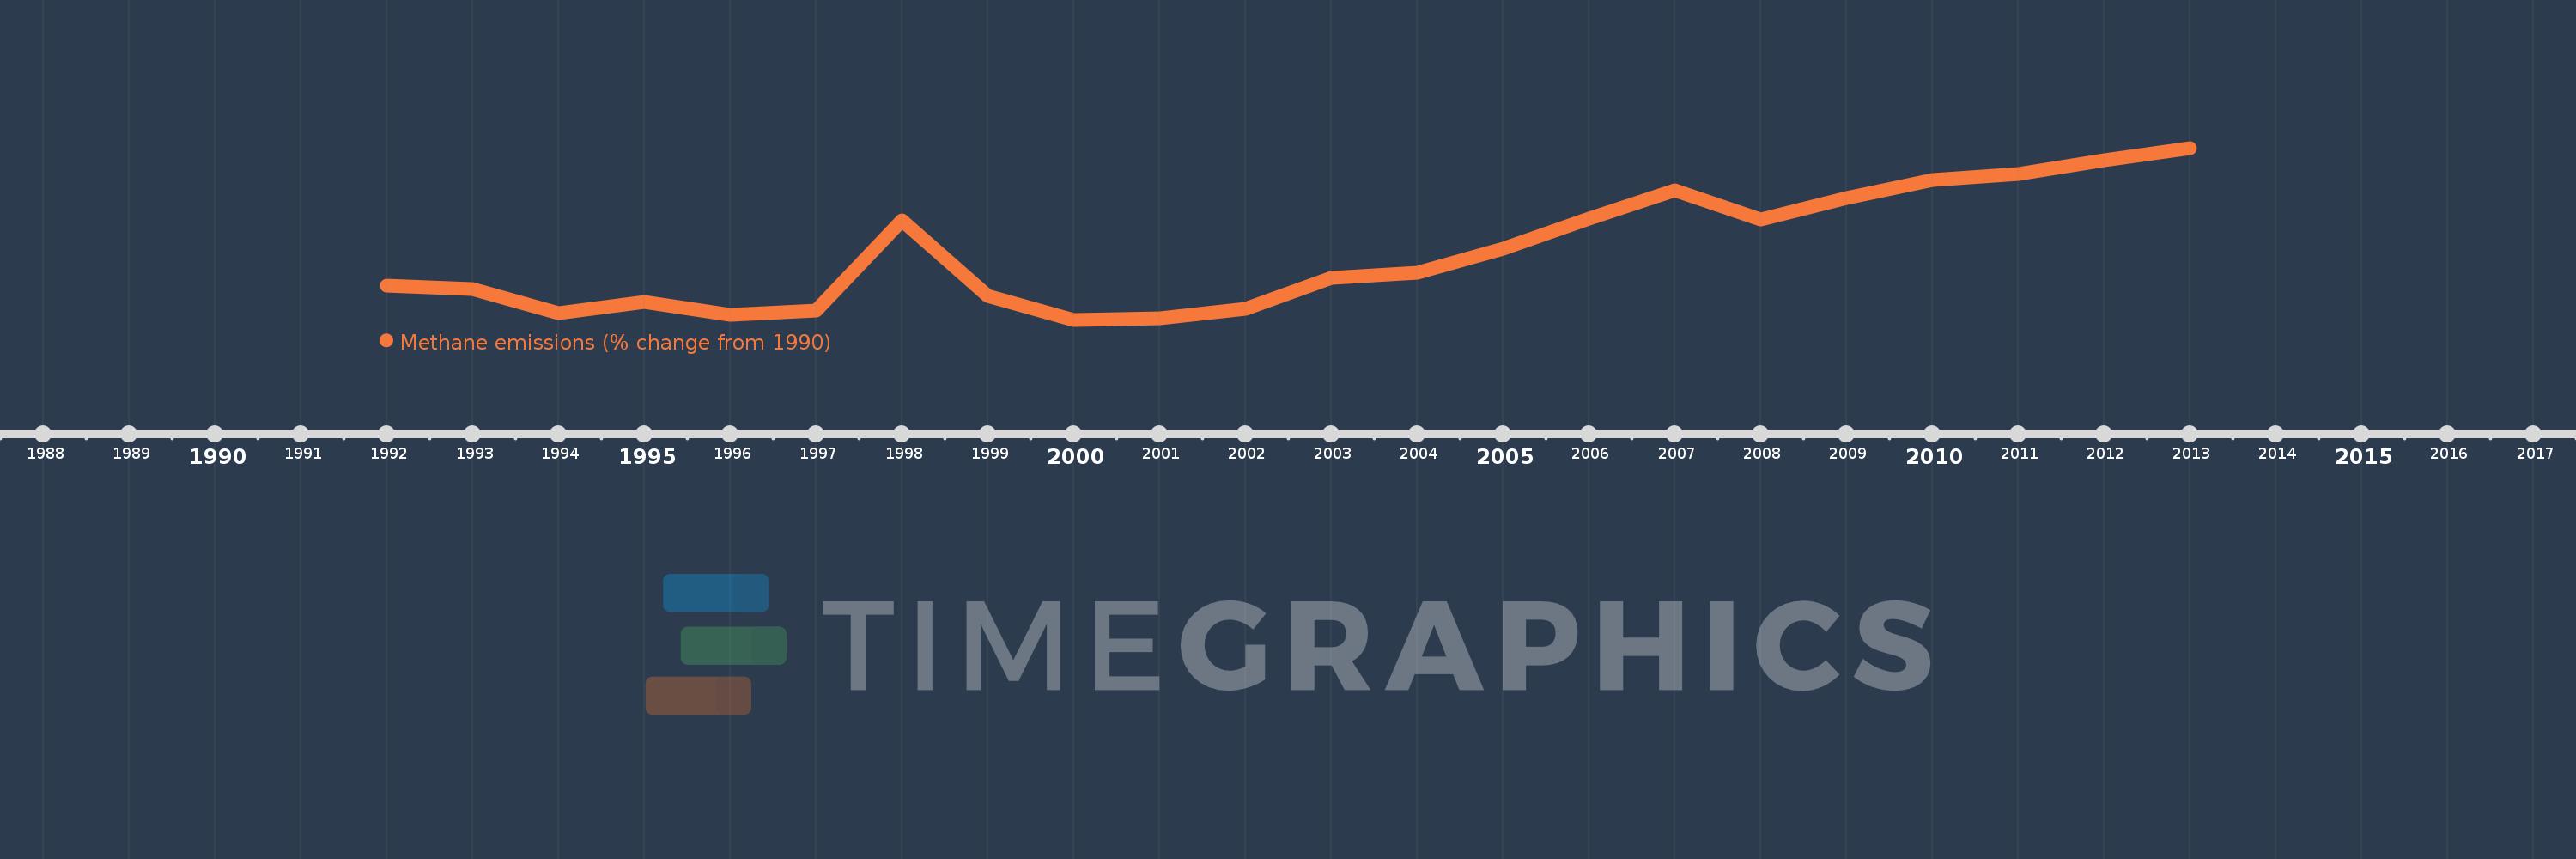
This timeline shows a graph from 1992 to 2013 of IBRD only. No data until 1991. Number of actual observations by date: 22.
Source name:
World Development Indicators
Source organization:
World Bank staff estimates from original source: European Commission, Joint Research Centre (JRC)/Netherlands Environmental Assessment Agency (PBL). Emission Database for Global Atmospheric Research (EDGAR): http://edgar.jrc.ec.europa.eu/.
Categories, topics:
Climate Change, Environment
Last updated:
apr 23, 2017
Indicators value changes by year
Meaning:
8.804
Minimum:
-3.215
jan 1, 2000
Maximum:
27.721
jan 1, 2013
At the date of observation
Value
Absolute change
Change from the previous value
jan 1, 1992
2.882
+2.882
0.0%
jan 1, 1993
2.328
-0.553
-19.2%
jan 1, 1994
-1.954
-4.282
-183.94%
jan 1, 1995
-0.02
+1.934
-98.96%
jan 1, 1996
-2.286
-2.266
11.12K%
jan 1, 1997
-1.52
+0.766
-33.51%
jan 1, 1998
14.714
+16.234
-1.07K%
jan 1, 1999
1.074
-13.64
-92.7%
jan 1, 2000
-3.215
-4.289
-399.39%
jan 1, 2001
-2.922
+0.293
-9.1%
jan 1, 2002
-1.281
+1.641
-56.15%
jan 1, 2003
4.342
+5.624
-438.88%
jan 1, 2004
5.225
+0.883
20.33%
jan 1, 2005
9.583
+4.358
83.4%
jan 1, 2006
15.011
+5.427
56.63%
jan 1, 2007
20.032
+5.021
33.45%
jan 1, 2008
14.838
-5.194
-25.93%
jan 1, 2009
18.68
+3.842
25.89%
jan 1, 2010
21.988
+3.308
17.71%
jan 1, 2011
22.981
+0.993
4.52%
jan 1, 2012
25.498
+2.517
10.95%
jan 1, 2013
27.721
+2.223
8.72%
Ranking of countries by current statistics by years
