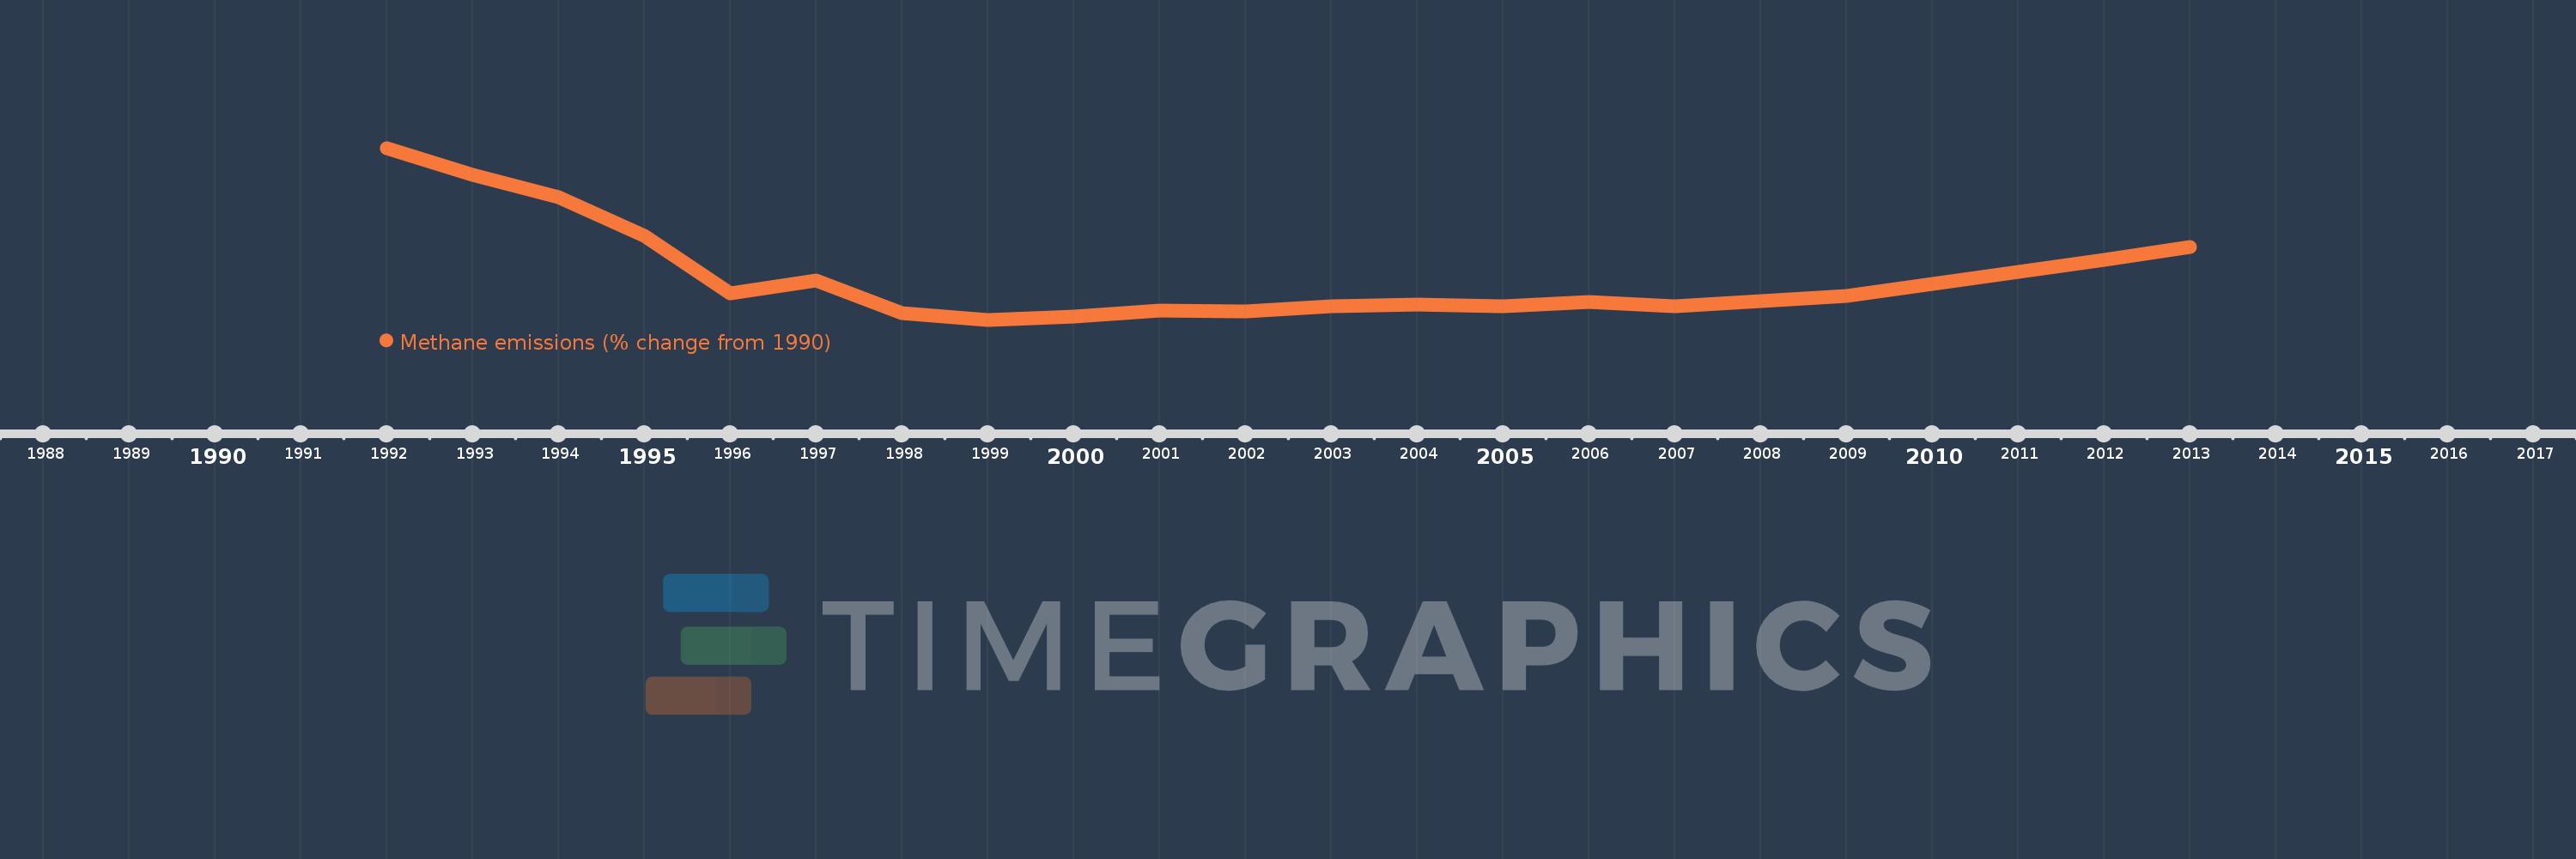
This timeline shows a graph from 1992 to 2013 of Kyrgyz Republic. No data until 1991. Number of actual observations by date: 22.
Source name:
World Development Indicators
Source organization:
World Bank staff estimates from original source: European Commission, Joint Research Centre (JRC)/Netherlands Environmental Assessment Agency (PBL). Emission Database for Global Atmospheric Research (EDGAR): http://edgar.jrc.ec.europa.eu/.
Categories, topics:
Climate Change, Environment
Last updated:
apr 23, 2017
Indicators value changes by year
Meaning:
-32.786
Minimum:
-42.229
jan 1, 1999
Maximum:
-4.632
jan 1, 1992
At the date of observation
Value
Absolute change
Change from the previous value
jan 1, 1992
-4.632
-4.632
0.0%
jan 1, 1993
-10.484
-5.852
126.32%
jan 1, 1994
-15.478
-4.994
47.63%
jan 1, 1995
-23.948
-8.47
54.72%
jan 1, 1996
-36.488
-12.54
52.36%
jan 1, 1997
-33.652
+2.836
-7.77%
jan 1, 1998
-40.707
-7.055
20.96%
jan 1, 1999
-42.229
-1.522
3.74%
jan 1, 2000
-41.451
+0.779
-1.84%
jan 1, 2001
-40.136
+1.315
-3.17%
jan 1, 2002
-40.354
-0.218
0.54%
jan 1, 2003
-39.323
+1.03
-2.55%
jan 1, 2004
-38.954
+0.37
-0.94%
jan 1, 2005
-39.201
-0.247
0.63%
jan 1, 2006
-38.323
+0.877
-2.24%
jan 1, 2007
-39.204
-0.881
2.3%
jan 1, 2008
-38.083
+1.121
-2.86%
jan 1, 2009
-37.066
+1.017
-2.67%
jan 1, 2010
-34.35
+2.716
-7.33%
jan 1, 2011
-31.846
+2.504
-7.29%
jan 1, 2012
-29.076
+2.771
-8.7%
jan 1, 2013
-26.305
+2.771
-9.53%
Ranking of countries by current statistics by years
