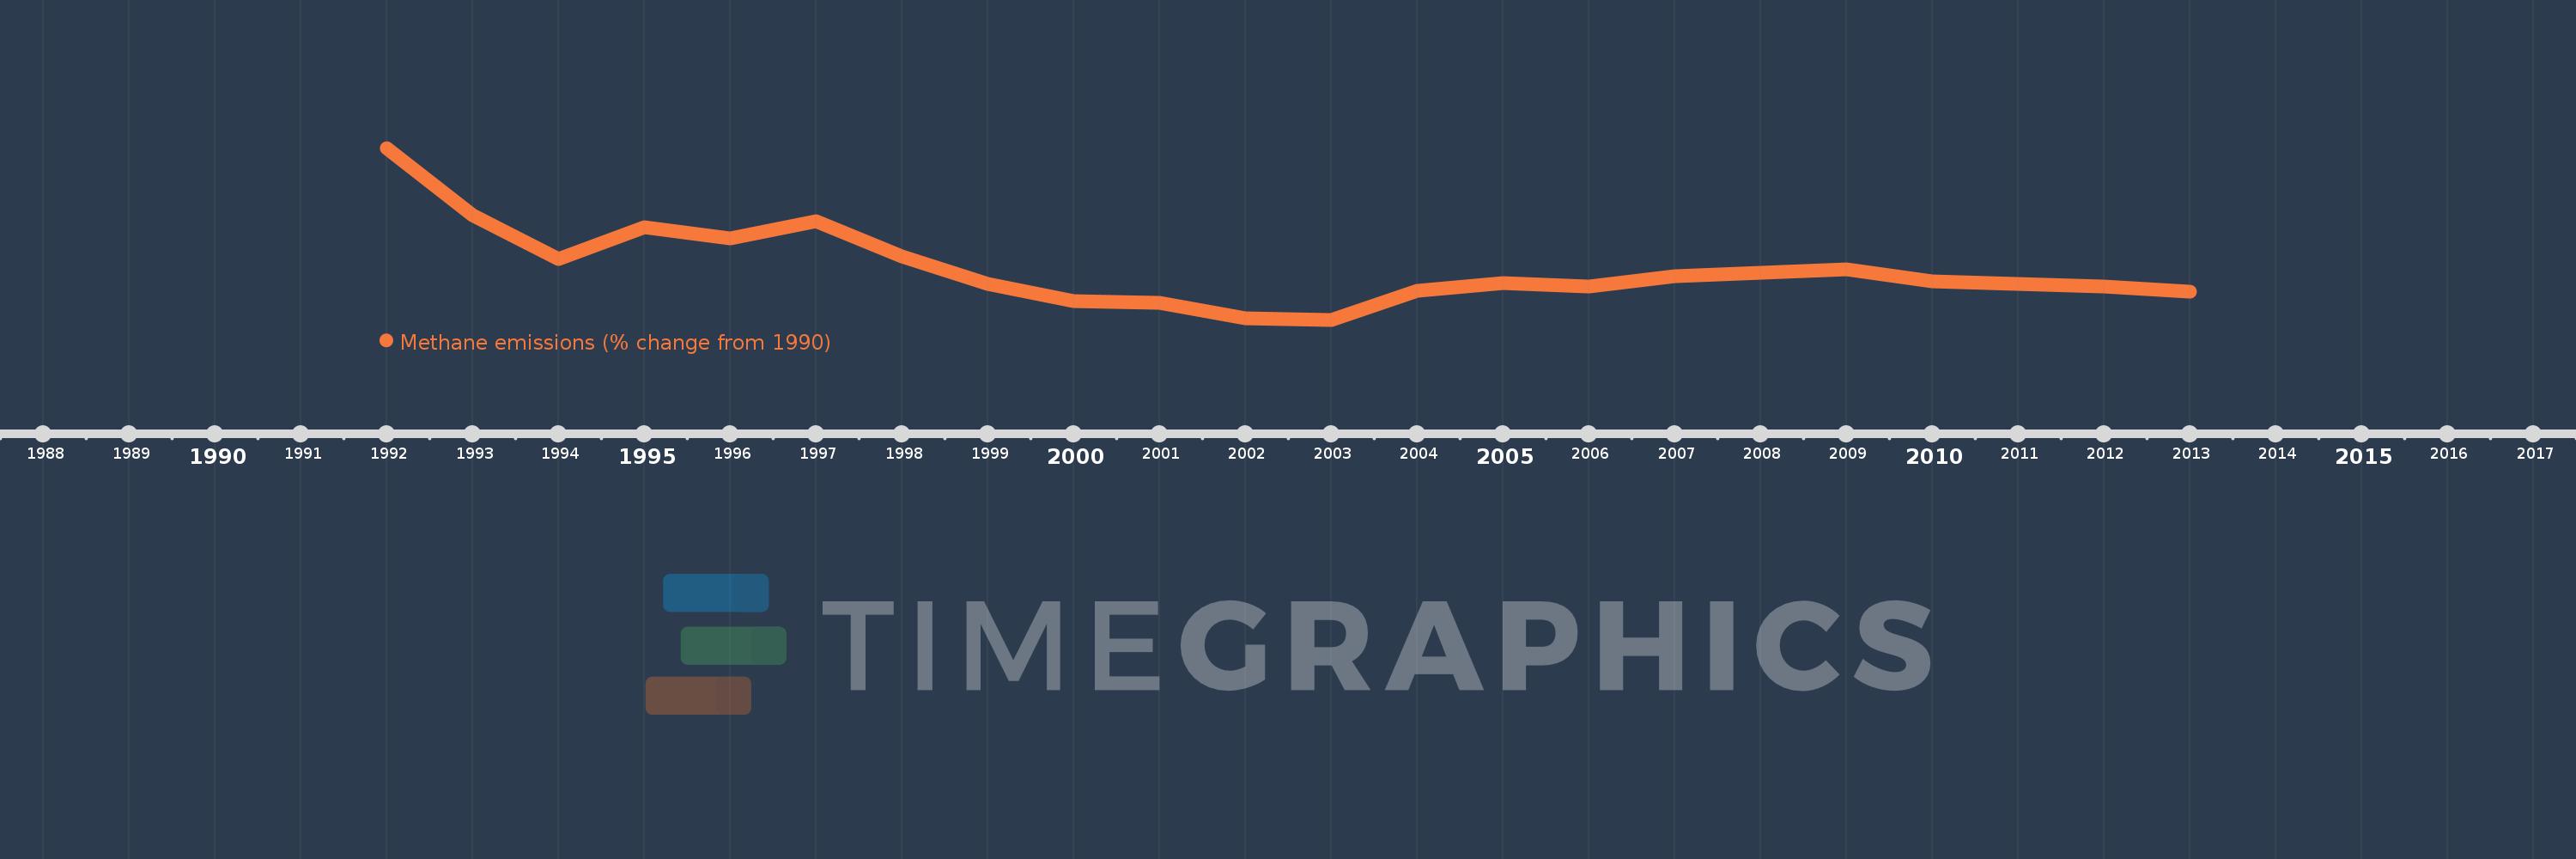
This timeline shows a graph from 1992 to 2013 of Romania. No data until 1991. Number of actual observations by date: 22.
Source name:
World Development Indicators
Source organization:
World Bank staff estimates from original source: European Commission, Joint Research Centre (JRC)/Netherlands Environmental Assessment Agency (PBL). Emission Database for Global Atmospheric Research (EDGAR): http://edgar.jrc.ec.europa.eu/.
Categories, topics:
Climate Change, Environment
Last updated:
apr 23, 2017
Indicators value changes by year
Meaning:
-28.164
Minimum:
-35.024
jan 1, 2003
Maximum:
-11.936
jan 1, 1992
At the date of observation
Value
Absolute change
Change from the previous value
jan 1, 1992
-11.936
-11.936
0.0%
jan 1, 1993
-20.957
-9.02
75.57%
jan 1, 1994
-26.817
-5.861
27.97%
jan 1, 1995
-22.606
+4.211
-15.7%
jan 1, 1996
-24.049
-1.443
6.38%
jan 1, 1997
-21.732
+2.317
-9.64%
jan 1, 1998
-26.47
-4.738
21.8%
jan 1, 1999
-30.182
-3.712
14.02%
jan 1, 2000
-32.557
-2.375
7.87%
jan 1, 2001
-32.793
-0.236
0.73%
jan 1, 2002
-34.784
-1.991
6.07%
jan 1, 2003
-35.024
-0.24
0.69%
jan 1, 2004
-31.107
+3.917
-11.18%
jan 1, 2005
-30.118
+0.989
-3.18%
jan 1, 2006
-30.554
-0.436
1.45%
jan 1, 2007
-29.131
+1.423
-4.66%
jan 1, 2008
-28.677
+0.455
-1.56%
jan 1, 2009
-28.267
+0.41
-1.43%
jan 1, 2010
-29.838
-1.571
5.56%
jan 1, 2011
-30.182
-0.344
1.15%
jan 1, 2012
-30.556
-0.374
1.24%
jan 1, 2013
-31.273
-0.718
2.35%
Ranking of countries by current statistics by years
