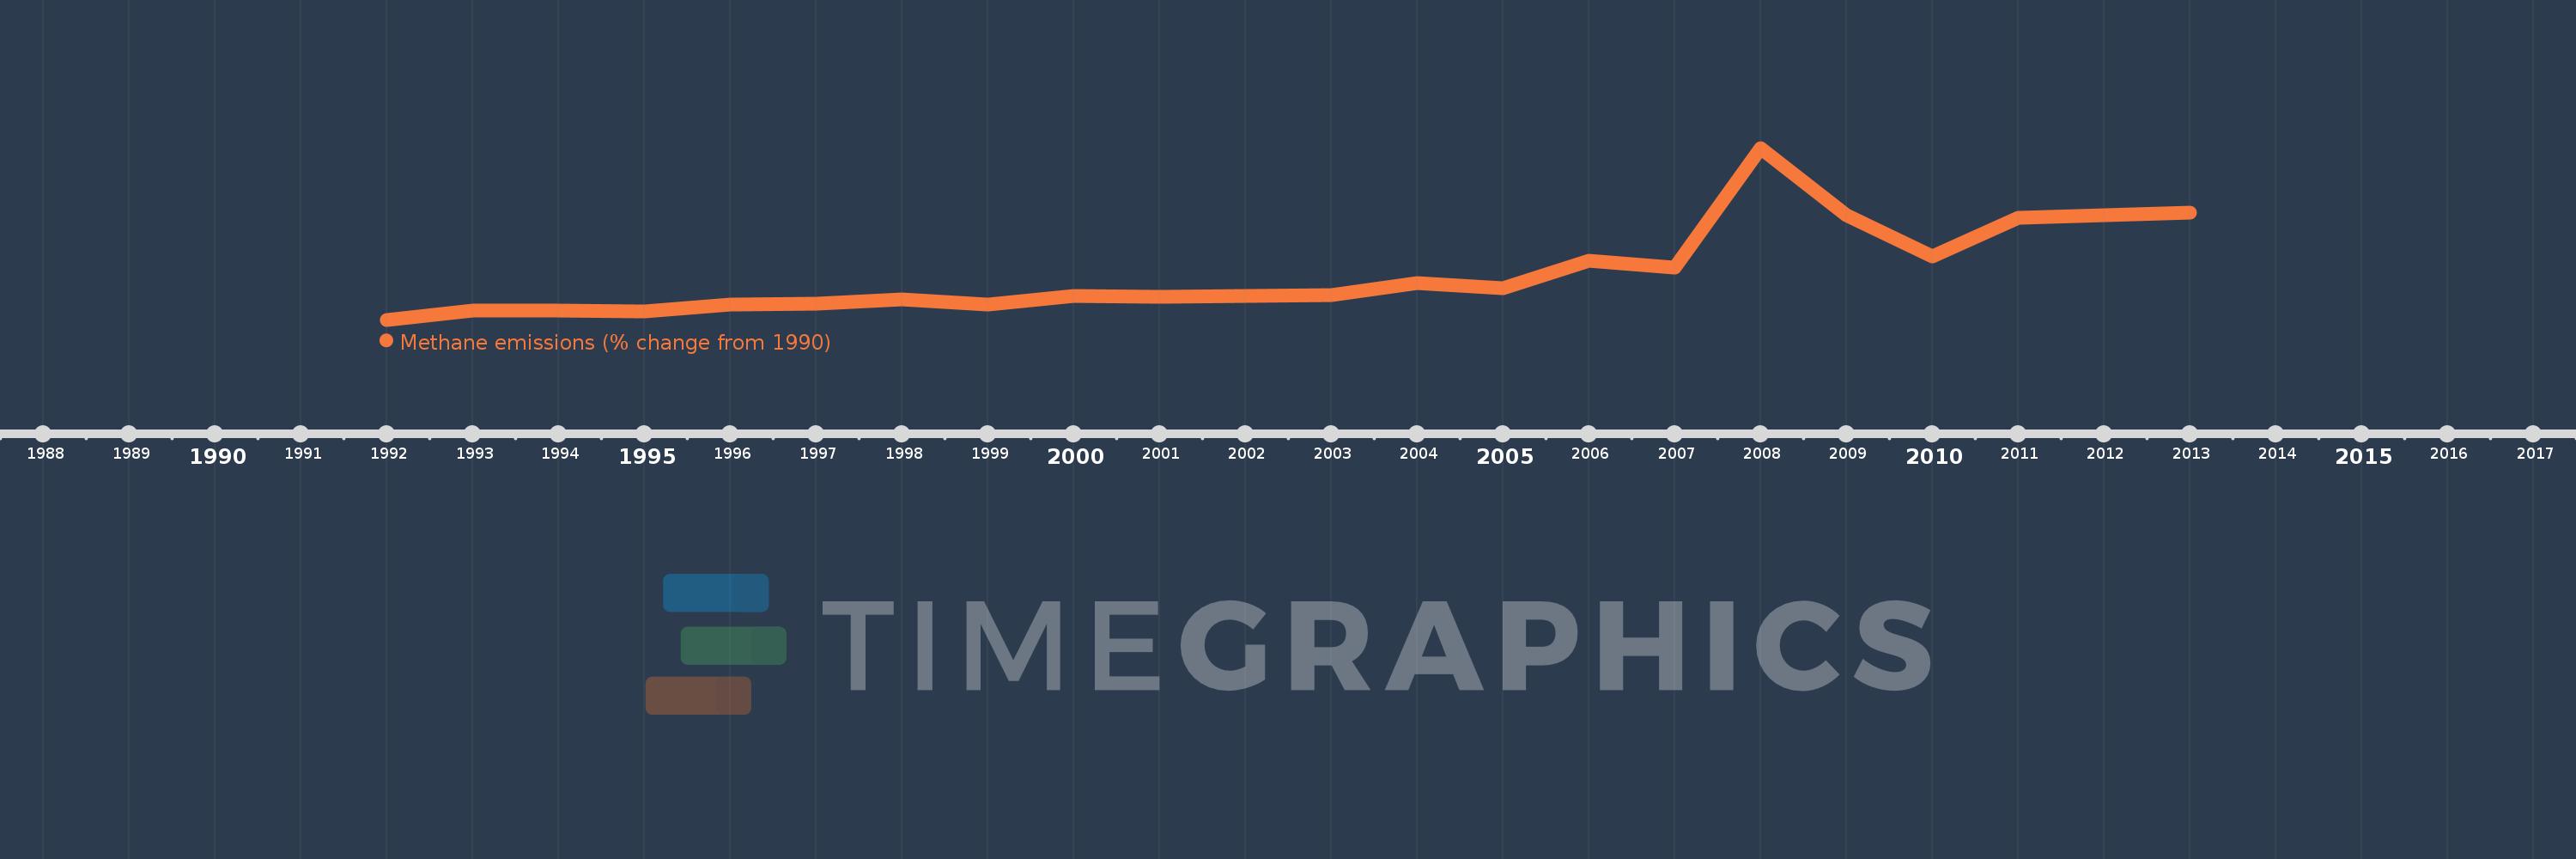
This timeline shows a graph from 1992 to 2013 of Uganda. No data until 1991. Number of actual observations by date: 22.
Source name:
World Development Indicators
Source organization:
World Bank staff estimates from original source: European Commission, Joint Research Centre (JRC)/Netherlands Environmental Assessment Agency (PBL). Emission Database for Global Atmospheric Research (EDGAR): http://edgar.jrc.ec.europa.eu/.
Categories, topics:
Climate Change, Environment
Last updated:
apr 23, 2017
Indicators value changes by year
Meaning:
28.548
Minimum:
-5.389
jan 1, 1992
Maximum:
120.391
jan 1, 2008
At the date of observation
Value
Absolute change
Change from the previous value
jan 1, 1992
-5.389
-5.389
0.0%
jan 1, 1993
1.455
+6.844
-127.0%
jan 1, 1994
1.14
-0.315
-21.66%
jan 1, 1995
0.631
-0.509
-44.63%
jan 1, 1996
5.833
+5.202
824.06%
jan 1, 1997
6.538
+0.706
12.1%
jan 1, 1998
9.222
+2.684
41.05%
jan 1, 1999
5.777
-3.445
-37.36%
jan 1, 2000
11.769
+5.991
103.7%
jan 1, 2001
11.107
-0.661
-5.62%
jan 1, 2002
12.103
+0.995
8.96%
jan 1, 2003
12.463
+0.361
2.98%
jan 1, 2004
21.748
+9.285
74.49%
jan 1, 2005
17.833
-3.915
-18.0%
jan 1, 2006
37.514
+19.68
110.36%
jan 1, 2007
32.642
-4.872
-12.99%
jan 1, 2008
120.391
+87.749
268.82%
jan 1, 2009
71.185
-49.206
-40.87%
jan 1, 2010
40.782
-30.403
-42.71%
jan 1, 2011
69.407
+28.625
70.19%
jan 1, 2012
71.101
+1.694
2.44%
jan 1, 2013
72.795
+1.694
2.38%
Ranking of countries by current statistics by years
