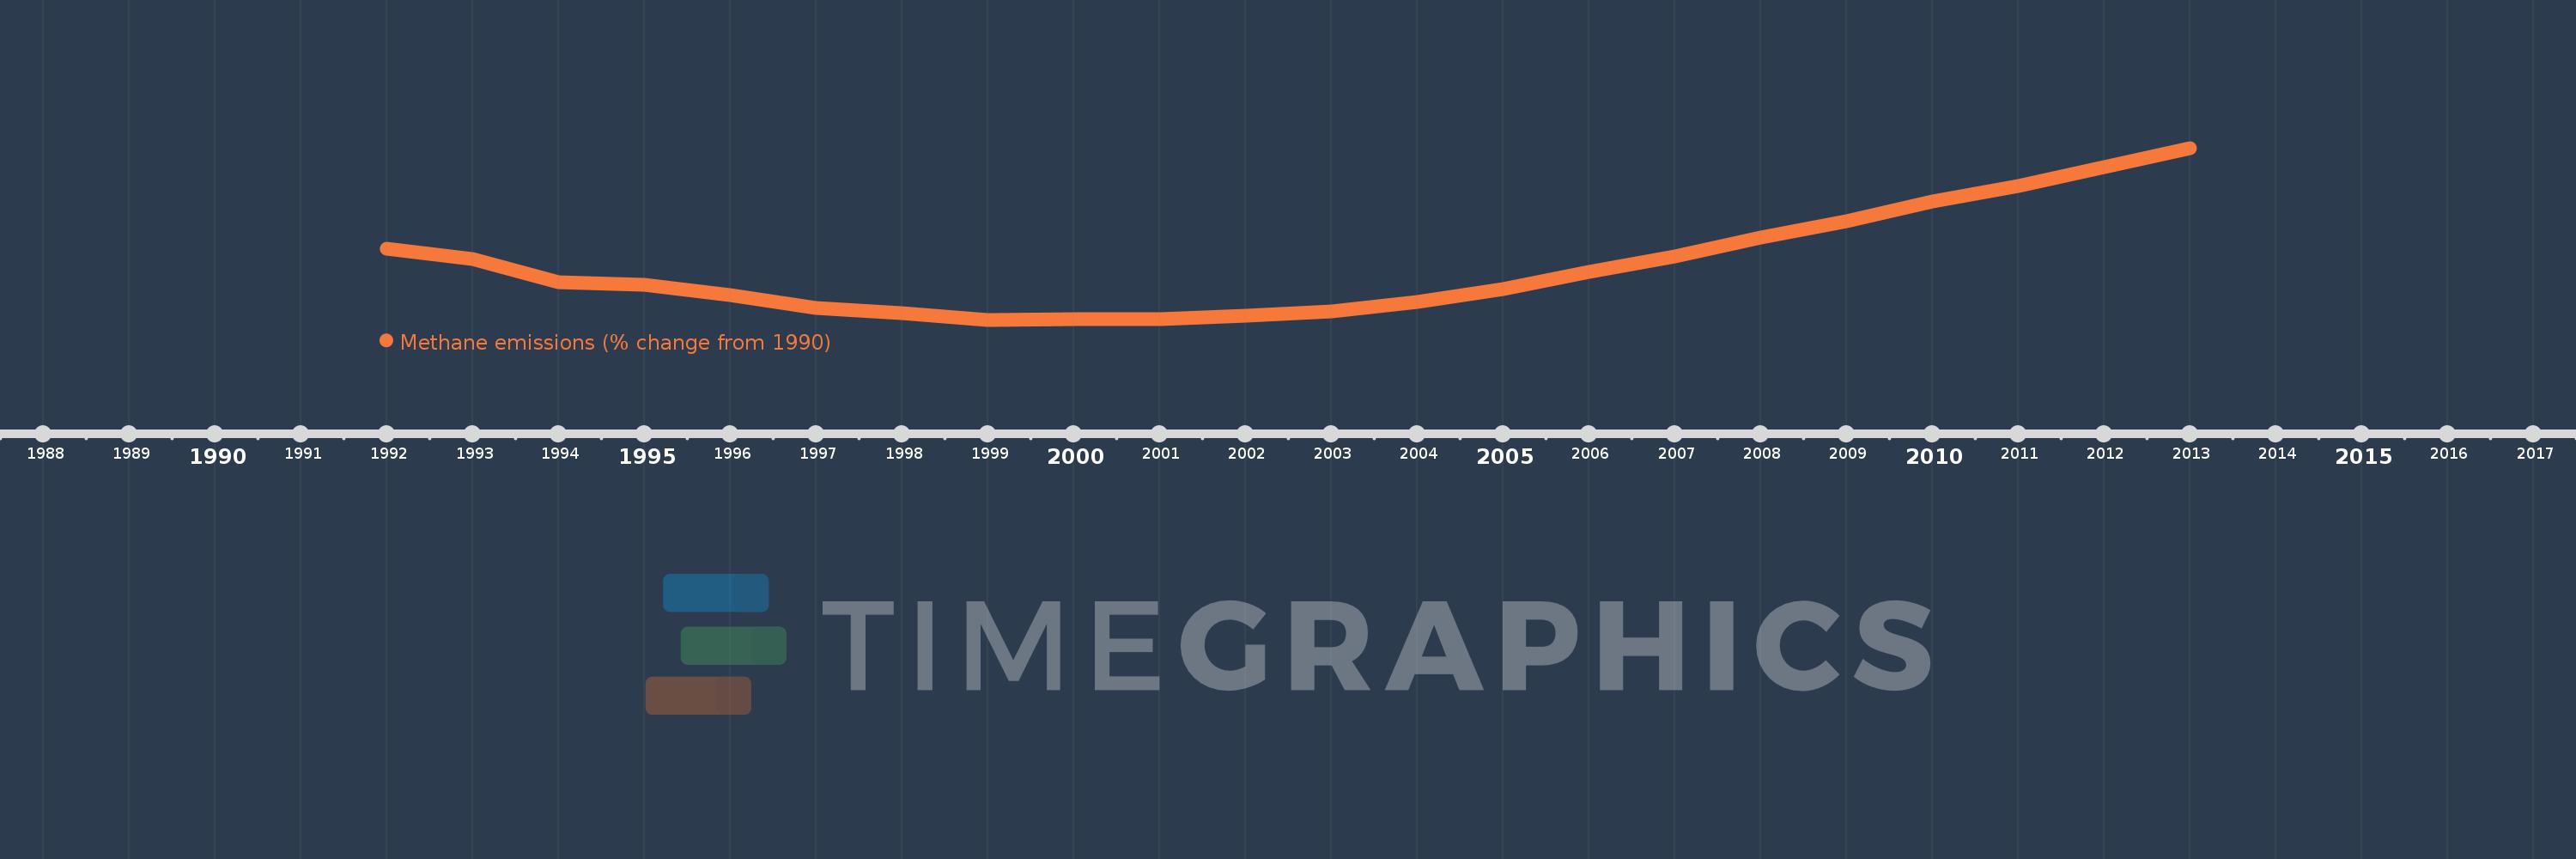
This timeline shows a graph from 1992 to 2013 of Tajikistan. No data until 1991. Number of actual observations by date: 22.
Source name:
World Development Indicators
Source organization:
World Bank staff estimates from original source: European Commission, Joint Research Centre (JRC)/Netherlands Environmental Assessment Agency (PBL). Emission Database for Global Atmospheric Research (EDGAR): http://edgar.jrc.ec.europa.eu/.
Categories, topics:
Climate Change, Environment
Last updated:
apr 23, 2017
Indicators value changes by year
Meaning:
-8.077
Minimum:
-23.411
jan 1, 1999
Maximum:
25.783
jan 1, 2013
At the date of observation
Value
Absolute change
Change from the previous value
jan 1, 1992
-3.124
-3.124
0.0%
jan 1, 1993
-5.988
-2.863
91.65%
jan 1, 1994
-12.691
-6.704
111.96%
jan 1, 1995
-13.495
-0.804
6.33%
jan 1, 1996
-16.36
-2.865
21.23%
jan 1, 1997
-20.11
-3.75
22.92%
jan 1, 1998
-21.478
-1.369
6.81%
jan 1, 1999
-23.411
-1.932
9.0%
jan 1, 2000
-23.295
+0.116
-0.5%
jan 1, 2001
-23.155
+0.14
-0.6%
jan 1, 2002
-22.344
+0.811
-3.5%
jan 1, 2003
-20.993
+1.351
-6.05%
jan 1, 2004
-18.42
+2.573
-12.26%
jan 1, 2005
-14.538
+3.882
-21.07%
jan 1, 2006
-9.633
+4.905
-33.74%
jan 1, 2007
-5.25
+4.383
-45.5%
jan 1, 2008
0.199
+5.449
-103.79%
jan 1, 2009
4.851
+4.653
2.34K%
jan 1, 2010
10.41
+5.558
114.57%
jan 1, 2011
14.972
+4.562
43.83%
jan 1, 2012
20.377
+5.406
36.11%
jan 1, 2013
25.783
+5.406
26.53%
Ranking of countries by current statistics by years
