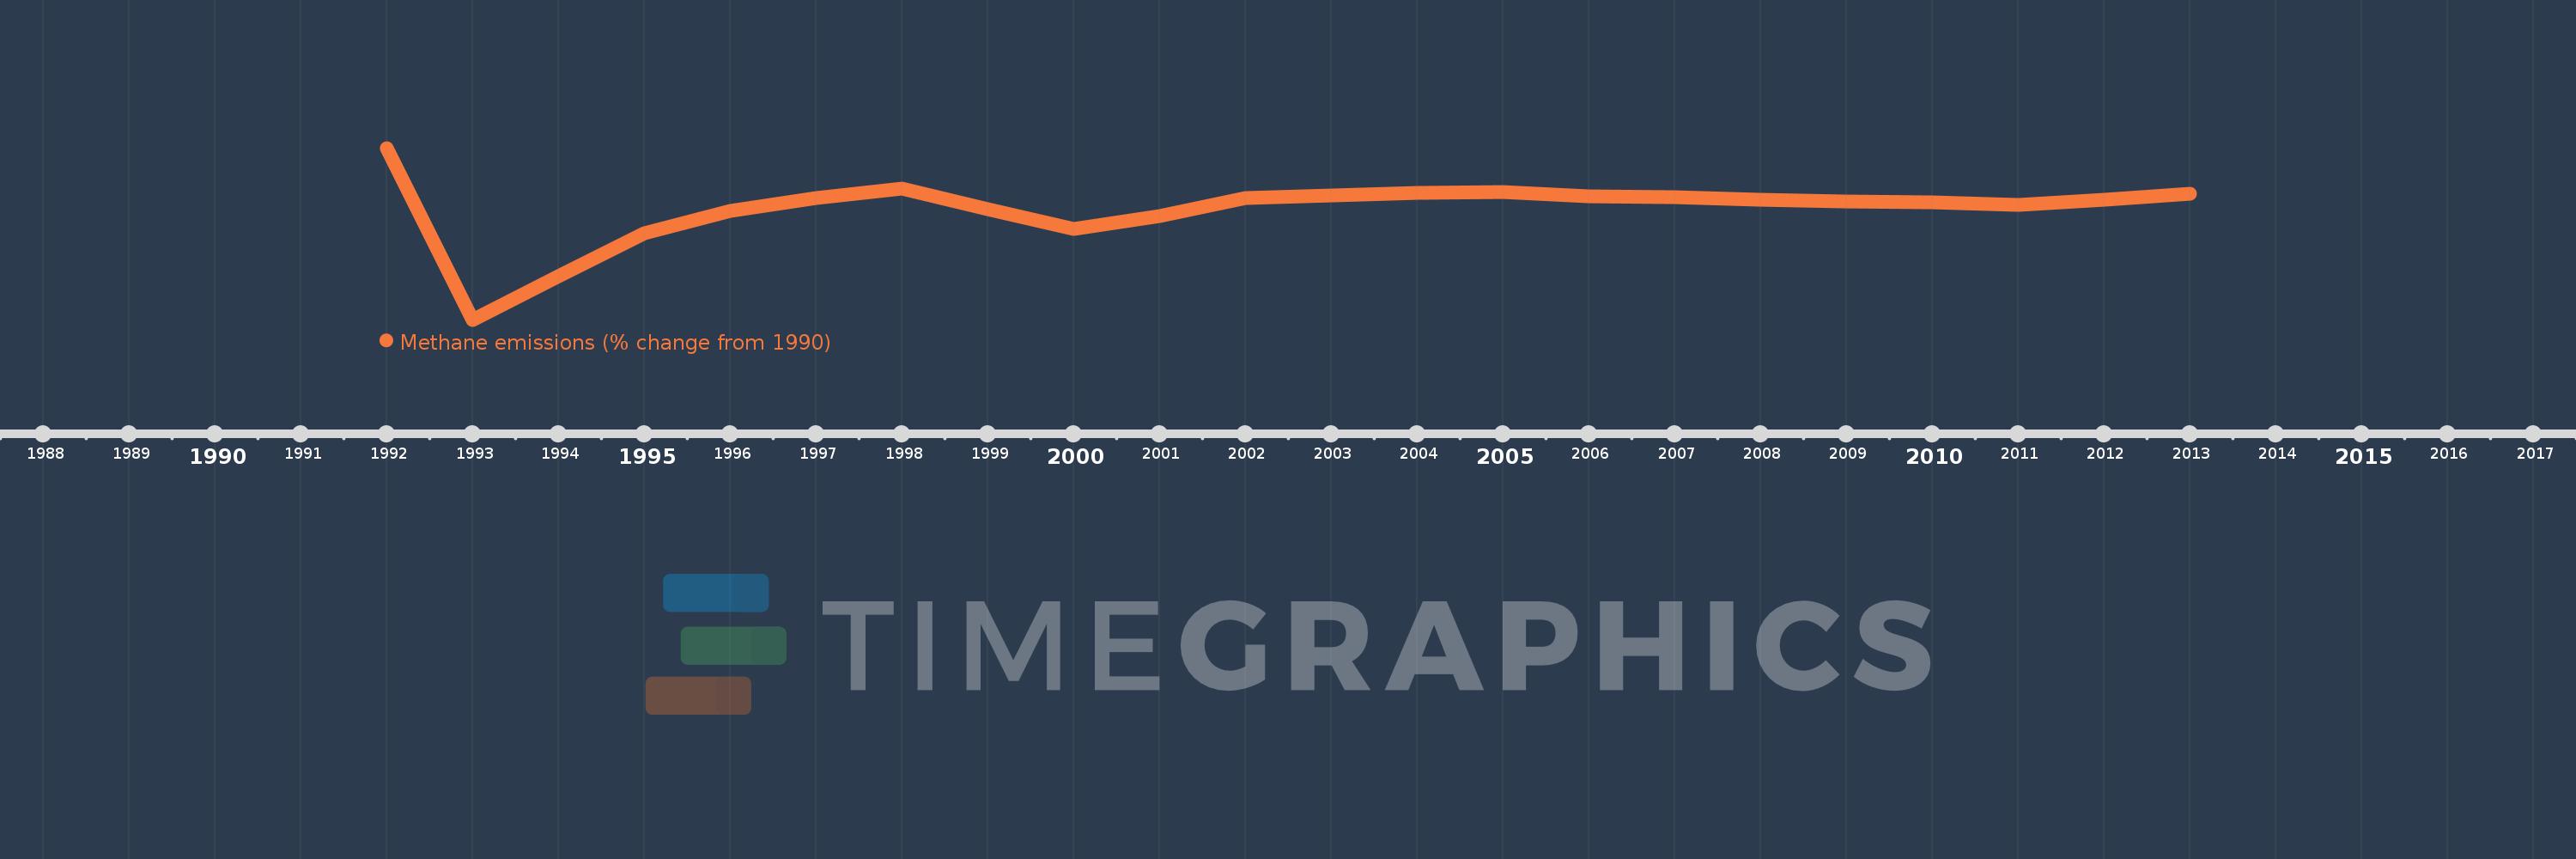
This timeline shows a graph from 1992 to 2013 of Solomon Islands. No data until 1991. Number of actual observations by date: 22.
Source name:
World Development Indicators
Source organization:
World Bank staff estimates from original source: European Commission, Joint Research Centre (JRC)/Netherlands Environmental Assessment Agency (PBL). Emission Database for Global Atmospheric Research (EDGAR): http://edgar.jrc.ec.europa.eu/.
Categories, topics:
Climate Change, Environment
Last updated:
apr 23, 2017
Indicators value changes by year
Meaning:
-31.036
Minimum:
-44.495
jan 1, 1993
Maximum:
-23.566
jan 1, 1992
At the date of observation
Value
Absolute change
Change from the previous value
jan 1, 1992
-23.566
-23.566
0.0%
jan 1, 1993
-44.495
-20.929
88.81%
jan 1, 1994
-39.197
+5.298
-11.91%
jan 1, 1995
-33.926
+5.271
-13.45%
jan 1, 1996
-31.251
+2.675
-7.88%
jan 1, 1997
-29.622
+1.629
-5.21%
jan 1, 1998
-28.517
+1.106
-3.73%
jan 1, 1999
-31.016
-2.5
8.77%
jan 1, 2000
-33.389
-2.372
7.65%
jan 1, 2001
-31.859
+1.529
-4.58%
jan 1, 2002
-29.689
+2.17
-6.81%
jan 1, 2003
-29.387
+0.302
-1.02%
jan 1, 2004
-29.08
+0.307
-1.04%
jan 1, 2005
-28.961
+0.119
-0.41%
jan 1, 2006
-29.429
-0.468
1.62%
jan 1, 2007
-29.595
-0.166
0.56%
jan 1, 2008
-29.89
-0.295
1.0%
jan 1, 2009
-30.115
-0.225
0.75%
jan 1, 2010
-30.226
-0.111
0.37%
jan 1, 2011
-30.553
-0.327
1.08%
jan 1, 2012
-29.859
+0.694
-2.27%
jan 1, 2013
-29.164
+0.694
-2.33%
Ranking of countries by current statistics by years
