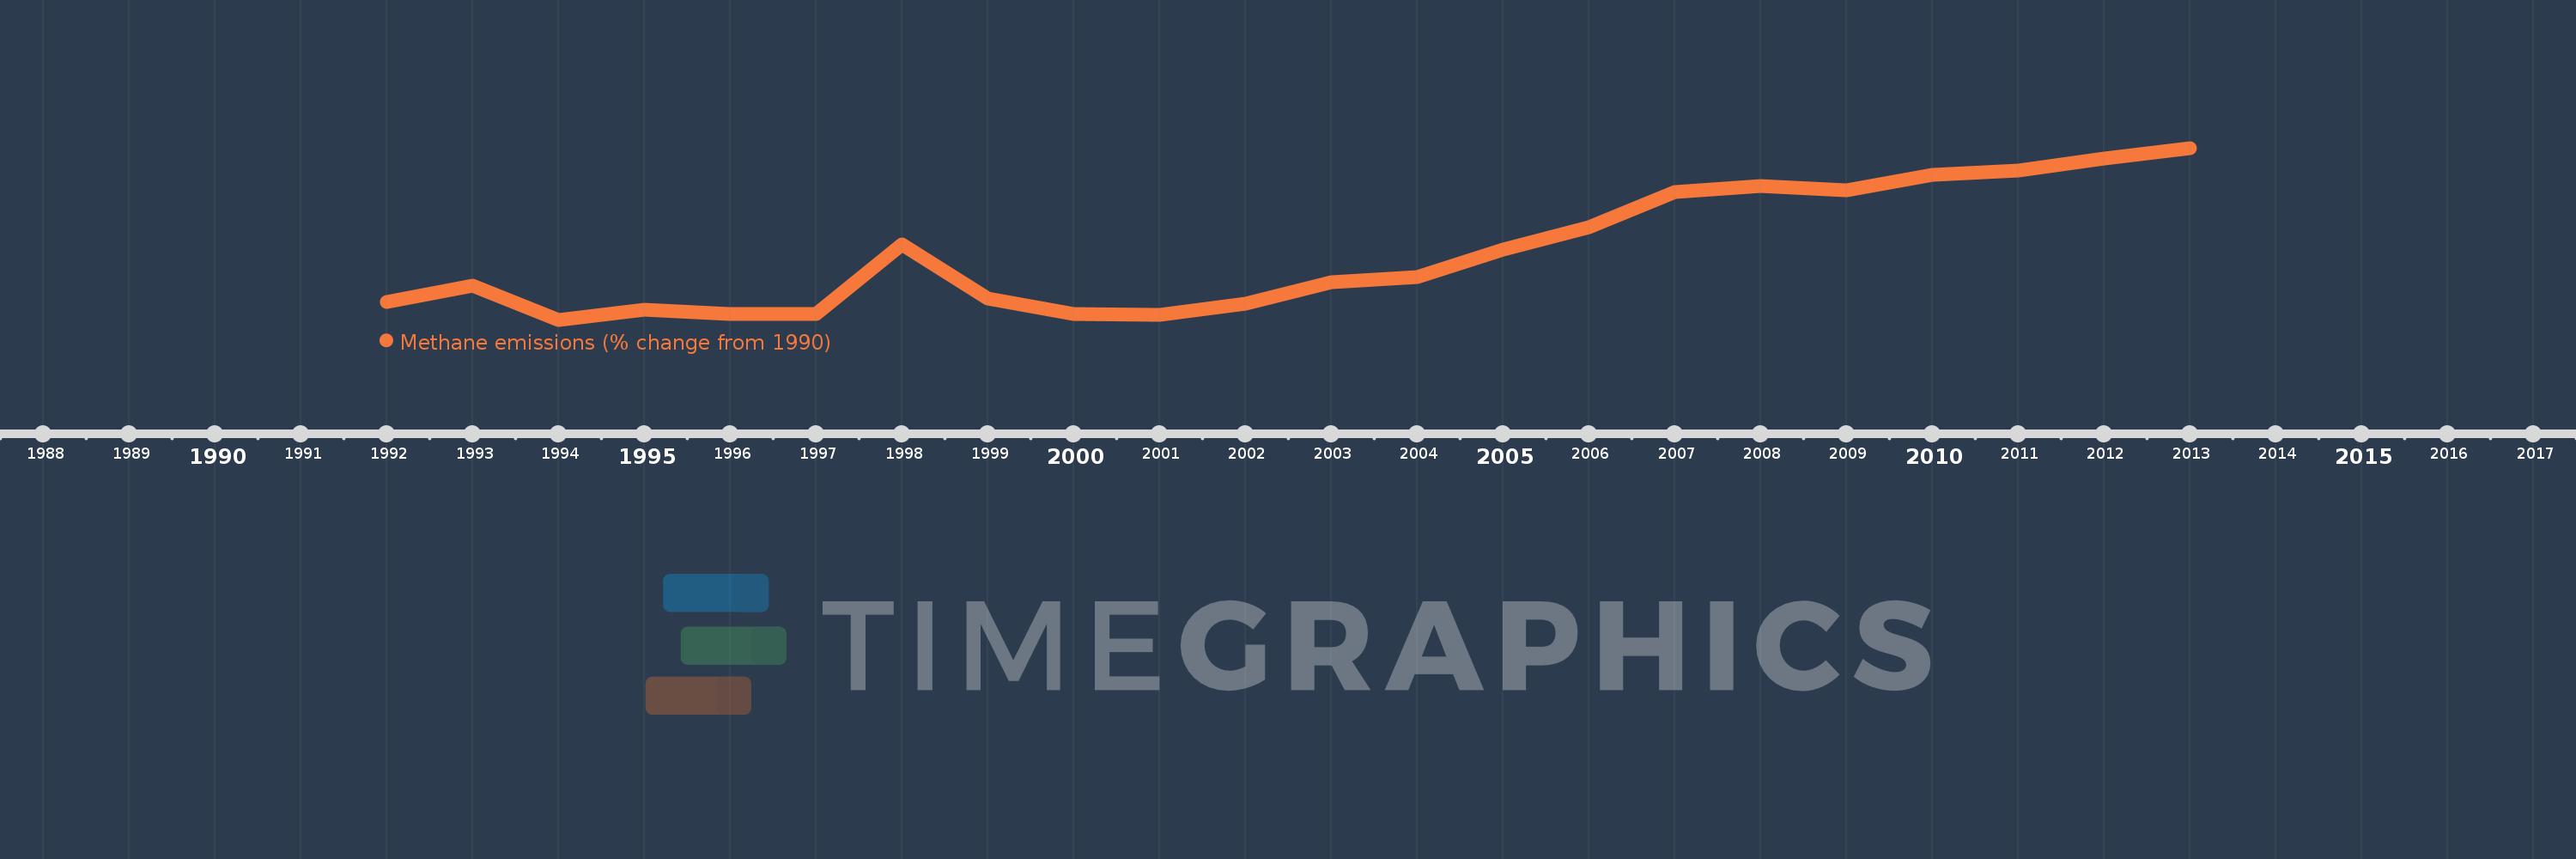
This timeline shows a graph from 1992 to 2013 of IDA & IBRD total. No data until 1991. Number of actual observations by date: 22.
Source name:
World Development Indicators
Source organization:
World Bank staff estimates from original source: European Commission, Joint Research Centre (JRC)/Netherlands Environmental Assessment Agency (PBL). Emission Database for Global Atmospheric Research (EDGAR): http://edgar.jrc.ec.europa.eu/.
Categories, topics:
Climate Change, Environment
Last updated:
apr 23, 2017
Indicators value changes by year
Meaning:
9.925
Minimum:
-2.589
jan 1, 1994
Maximum:
29.898
jan 1, 2013
At the date of observation
Value
Absolute change
Change from the previous value
jan 1, 1992
0.732
+0.732
0.0%
jan 1, 1993
3.818
+3.086
421.68%
jan 1, 1994
-2.589
-6.408
-167.82%
jan 1, 1995
-0.641
+1.948
-75.24%
jan 1, 1996
-1.459
-0.818
127.55%
jan 1, 1997
-1.552
-0.093
6.41%
jan 1, 1998
11.687
+13.239
-852.95%
jan 1, 1999
1.369
-10.318
-88.29%
jan 1, 2000
-1.573
-2.942
-214.9%
jan 1, 2001
-1.71
-0.138
8.75%
jan 1, 2002
0.479
+2.19
-128.02%
jan 1, 2003
4.576
+4.096
854.79%
jan 1, 2004
5.439
+0.863
18.87%
jan 1, 2005
10.627
+5.188
95.39%
jan 1, 2006
14.872
+4.245
39.95%
jan 1, 2007
21.53
+6.658
44.77%
jan 1, 2008
22.767
+1.237
5.74%
jan 1, 2009
21.916
-0.851
-3.74%
jan 1, 2010
24.738
+2.822
12.88%
jan 1, 2011
25.572
+0.834
3.37%
jan 1, 2012
27.852
+2.28
8.91%
jan 1, 2013
29.898
+2.046
7.35%
Ranking of countries by current statistics by years
