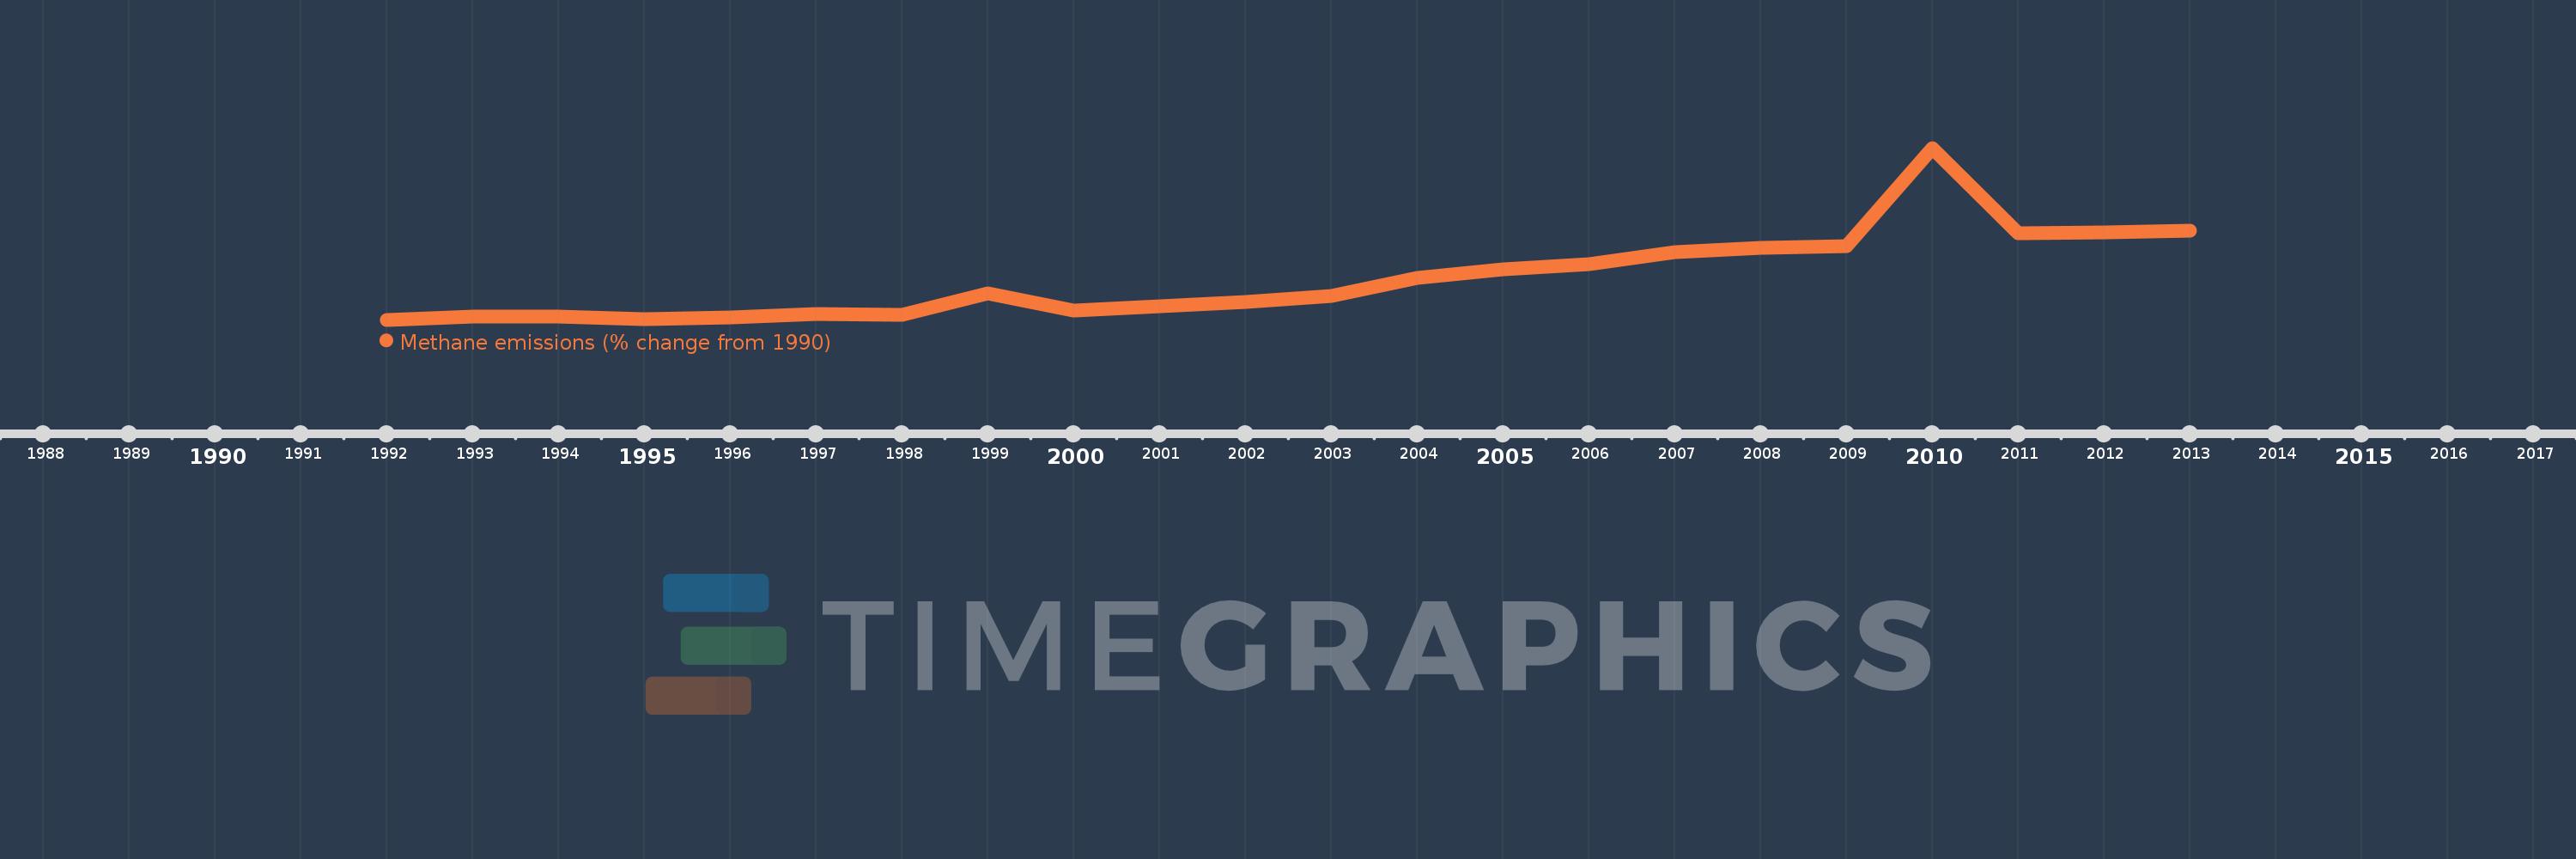
This timeline shows a graph from 1992 to 2013 of Caribbean small states. No data until 1991. Number of actual observations by date: 22.
Source name:
World Development Indicators
Source organization:
World Bank staff estimates from original source: European Commission, Joint Research Centre (JRC)/Netherlands Environmental Assessment Agency (PBL). Emission Database for Global Atmospheric Research (EDGAR): http://edgar.jrc.ec.europa.eu/.
Categories, topics:
Climate Change, Environment
Last updated:
apr 23, 2017
Indicators value changes by year
Meaning:
83.8
Minimum:
4.042
jan 1, 1992
Maximum:
335.782
jan 1, 2010
At the date of observation
Value
Absolute change
Change from the previous value
jan 1, 1992
4.042
+4.042
0.0%
jan 1, 1993
10.093
+6.051
149.71%
jan 1, 1994
10.859
+0.766
7.59%
jan 1, 1995
5.933
-4.927
-45.37%
jan 1, 1996
8.48
+2.547
42.93%
jan 1, 1997
15.054
+6.574
77.52%
jan 1, 1998
13.929
-1.125
-7.47%
jan 1, 1999
54.665
+40.737
292.47%
jan 1, 2000
21.79
-32.875
-60.14%
jan 1, 2001
30.214
+8.424
38.66%
jan 1, 2002
39.069
+8.855
29.31%
jan 1, 2003
50.662
+11.593
29.67%
jan 1, 2004
84.768
+34.106
67.32%
jan 1, 2005
102.213
+17.445
20.58%
jan 1, 2006
111.21
+8.997
8.8%
jan 1, 2007
135.005
+23.796
21.4%
jan 1, 2008
143.307
+8.302
6.15%
jan 1, 2009
145.991
+2.683
1.87%
jan 1, 2010
335.782
+189.792
130.0%
jan 1, 2011
170.801
-164.981
-49.13%
jan 1, 2012
173.509
+2.708
1.59%
jan 1, 2013
176.217
+2.708
1.56%
Ranking of countries by current statistics by years
