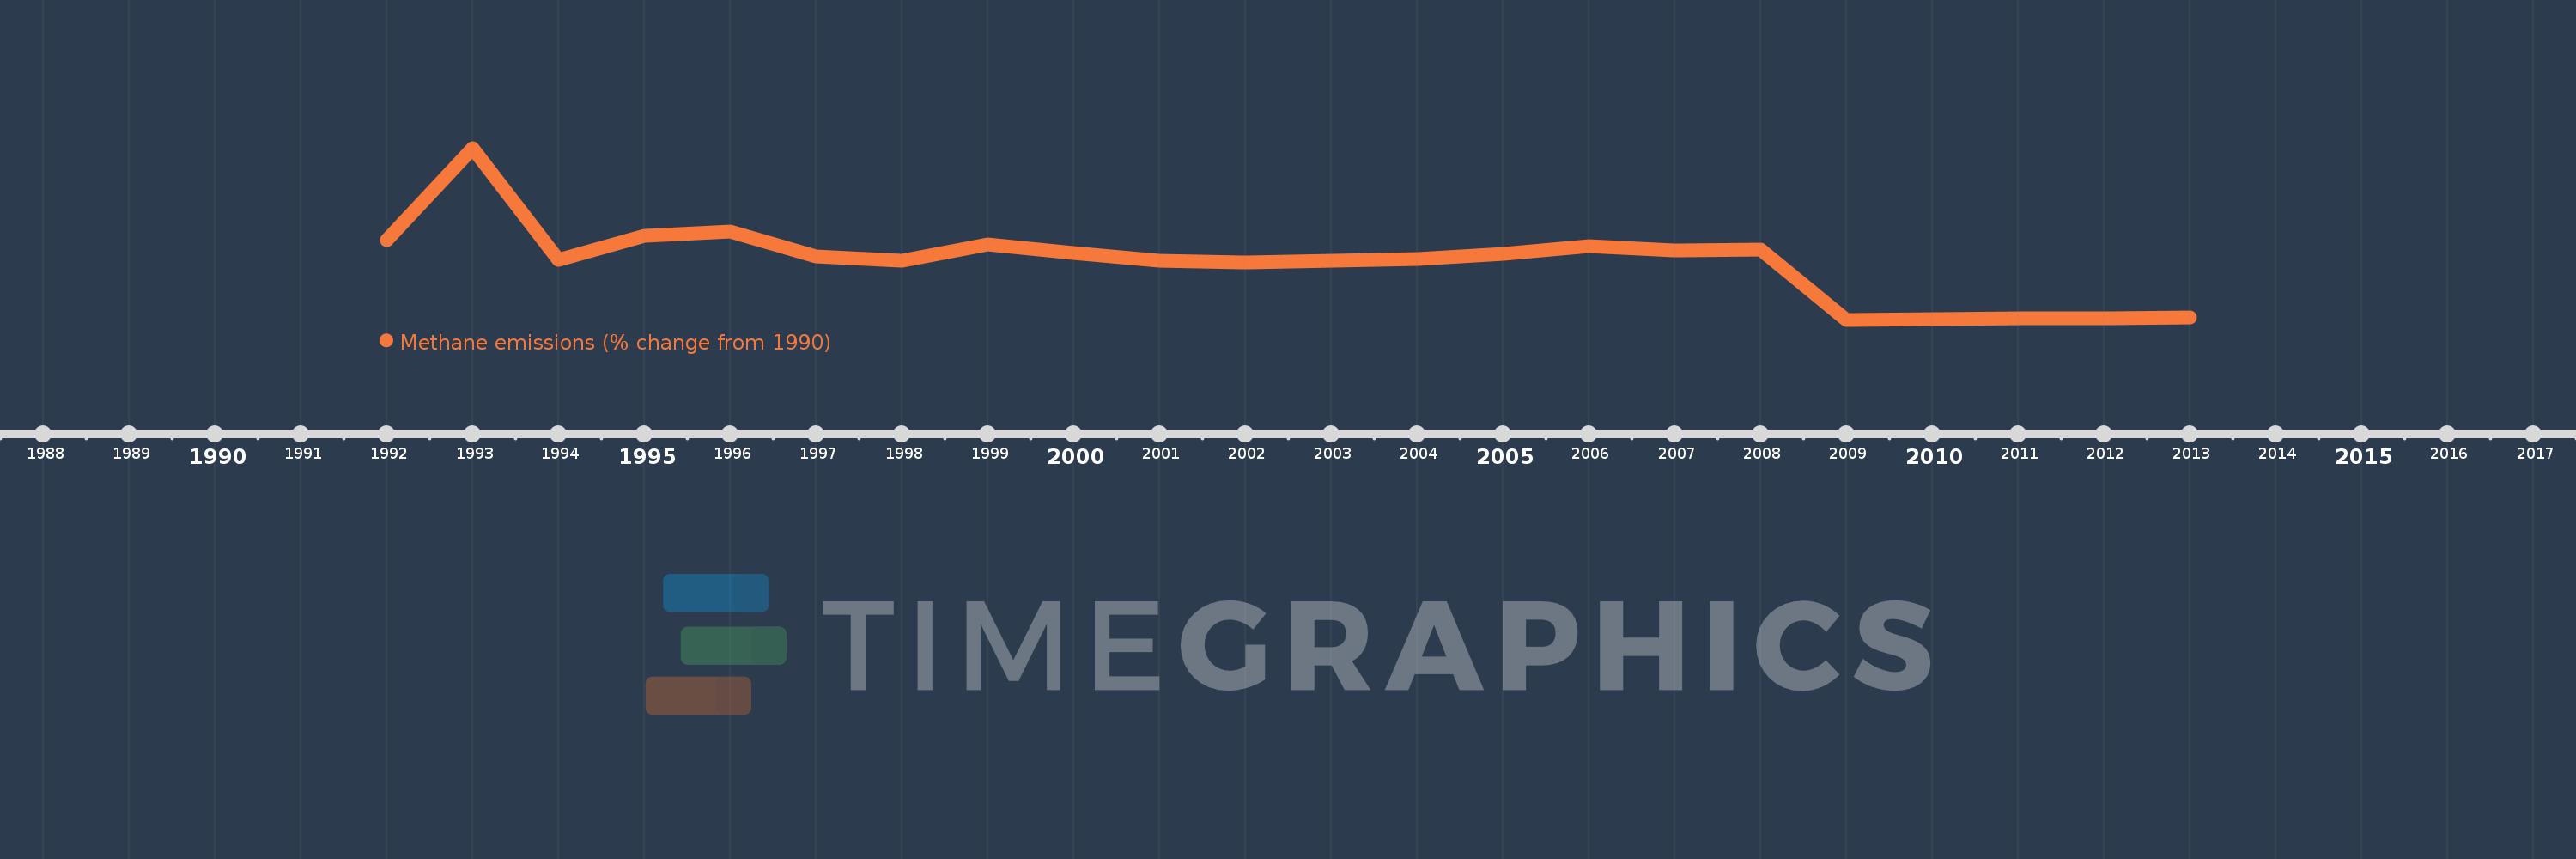
This timeline shows a graph from 1992 to 2013 of Zambia. No data until 1991. Number of actual observations by date: 22.
Source name:
World Development Indicators
Source organization:
World Bank staff estimates from original source: European Commission, Joint Research Centre (JRC)/Netherlands Environmental Assessment Agency (PBL). Emission Database for Global Atmospheric Research (EDGAR): http://edgar.jrc.ec.europa.eu/.
Categories, topics:
Climate Change, Environment
Last updated:
apr 23, 2017
Indicators value changes by year
Meaning:
-38.542
Minimum:
-78.979
jan 1, 2009
Maximum:
41.538
jan 1, 1993
At the date of observation
Value
Absolute change
Change from the previous value
jan 1, 1992
-22.994
-22.994
0.0%
jan 1, 1993
41.538
+64.532
-280.64%
jan 1, 1994
-37.193
-78.731
-189.54%
jan 1, 1995
-20.016
+17.177
-46.18%
jan 1, 1996
-17.269
+2.747
-13.72%
jan 1, 1997
-34.838
-17.569
101.73%
jan 1, 1998
-37.841
-3.003
8.62%
jan 1, 1999
-25.926
+11.915
-31.49%
jan 1, 2000
-31.887
-5.961
22.99%
jan 1, 2001
-37.843
-5.956
18.68%
jan 1, 2002
-38.528
-0.685
1.81%
jan 1, 2003
-37.831
+0.697
-1.81%
jan 1, 2004
-36.408
+1.423
-3.76%
jan 1, 2005
-32.858
+3.551
-9.75%
jan 1, 2006
-27.225
+5.633
-17.14%
jan 1, 2007
-30.645
-3.42
12.56%
jan 1, 2008
-29.617
+1.028
-3.36%
jan 1, 2009
-78.979
-49.362
166.67%
jan 1, 2010
-78.387
+0.592
-0.75%
jan 1, 2011
-77.943
+0.444
-0.57%
jan 1, 2012
-77.722
+0.221
-0.28%
jan 1, 2013
-77.502
+0.221
-0.28%
Ranking of countries by current statistics by years
