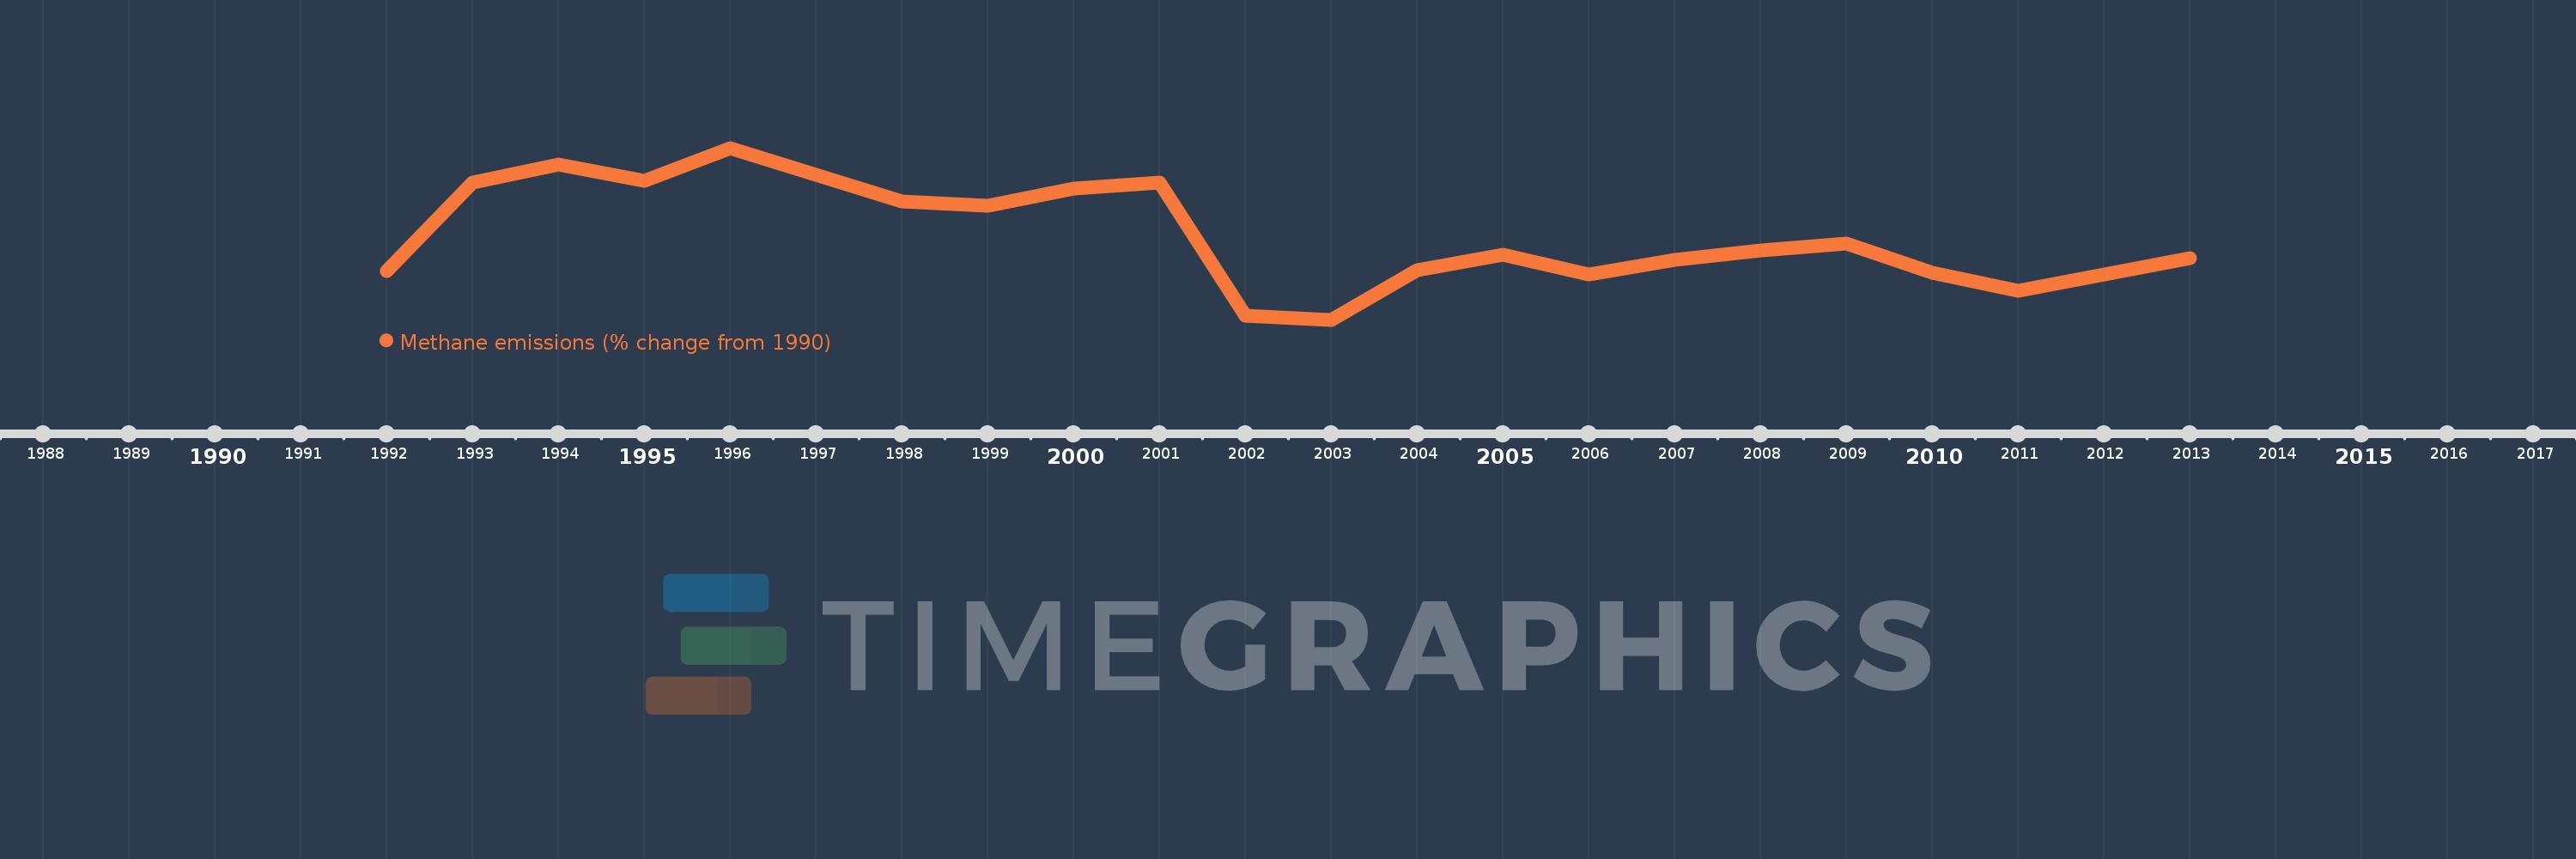
This timeline shows a graph from 1992 to 2013 of Jamaica. No data until 1991. Number of actual observations by date: 22.
Source name:
World Development Indicators
Source organization:
World Bank staff estimates from original source: European Commission, Joint Research Centre (JRC)/Netherlands Environmental Assessment Agency (PBL). Emission Database for Global Atmospheric Research (EDGAR): http://edgar.jrc.ec.europa.eu/.
Categories, topics:
Climate Change, Environment
Last updated:
apr 23, 2017
Indicators value changes by year
Meaning:
7.926
Minimum:
2.574
jan 1, 2003
Maximum:
13.518
jan 1, 1996
At the date of observation
Value
Absolute change
Change from the previous value
jan 1, 1992
5.698
+5.698
0.0%
jan 1, 1993
11.292
+5.594
98.18%
jan 1, 1994
12.458
+1.166
10.32%
jan 1, 1995
11.417
-1.04
-8.35%
jan 1, 1996
13.518
+2.101
18.4%
jan 1, 1997
11.79
-1.728
-12.78%
jan 1, 1998
10.084
-1.706
-14.47%
jan 1, 1999
9.842
-0.242
-2.4%
jan 1, 2000
10.947
+1.105
11.23%
jan 1, 2001
11.336
+0.389
3.55%
jan 1, 2002
2.814
-8.523
-75.18%
jan 1, 2003
2.574
-0.239
-8.51%
jan 1, 2004
5.736
+3.162
122.82%
jan 1, 2005
6.702
+0.967
16.85%
jan 1, 2006
5.44
-1.263
-18.84%
jan 1, 2007
6.373
+0.934
17.16%
jan 1, 2008
6.979
+0.606
9.51%
jan 1, 2009
7.43
+0.451
6.46%
jan 1, 2010
5.567
-1.862
-25.07%
jan 1, 2011
4.411
-1.156
-20.76%
jan 1, 2012
5.456
+1.044
23.67%
jan 1, 2013
6.5
+1.044
19.14%
Ranking of countries by current statistics by years
