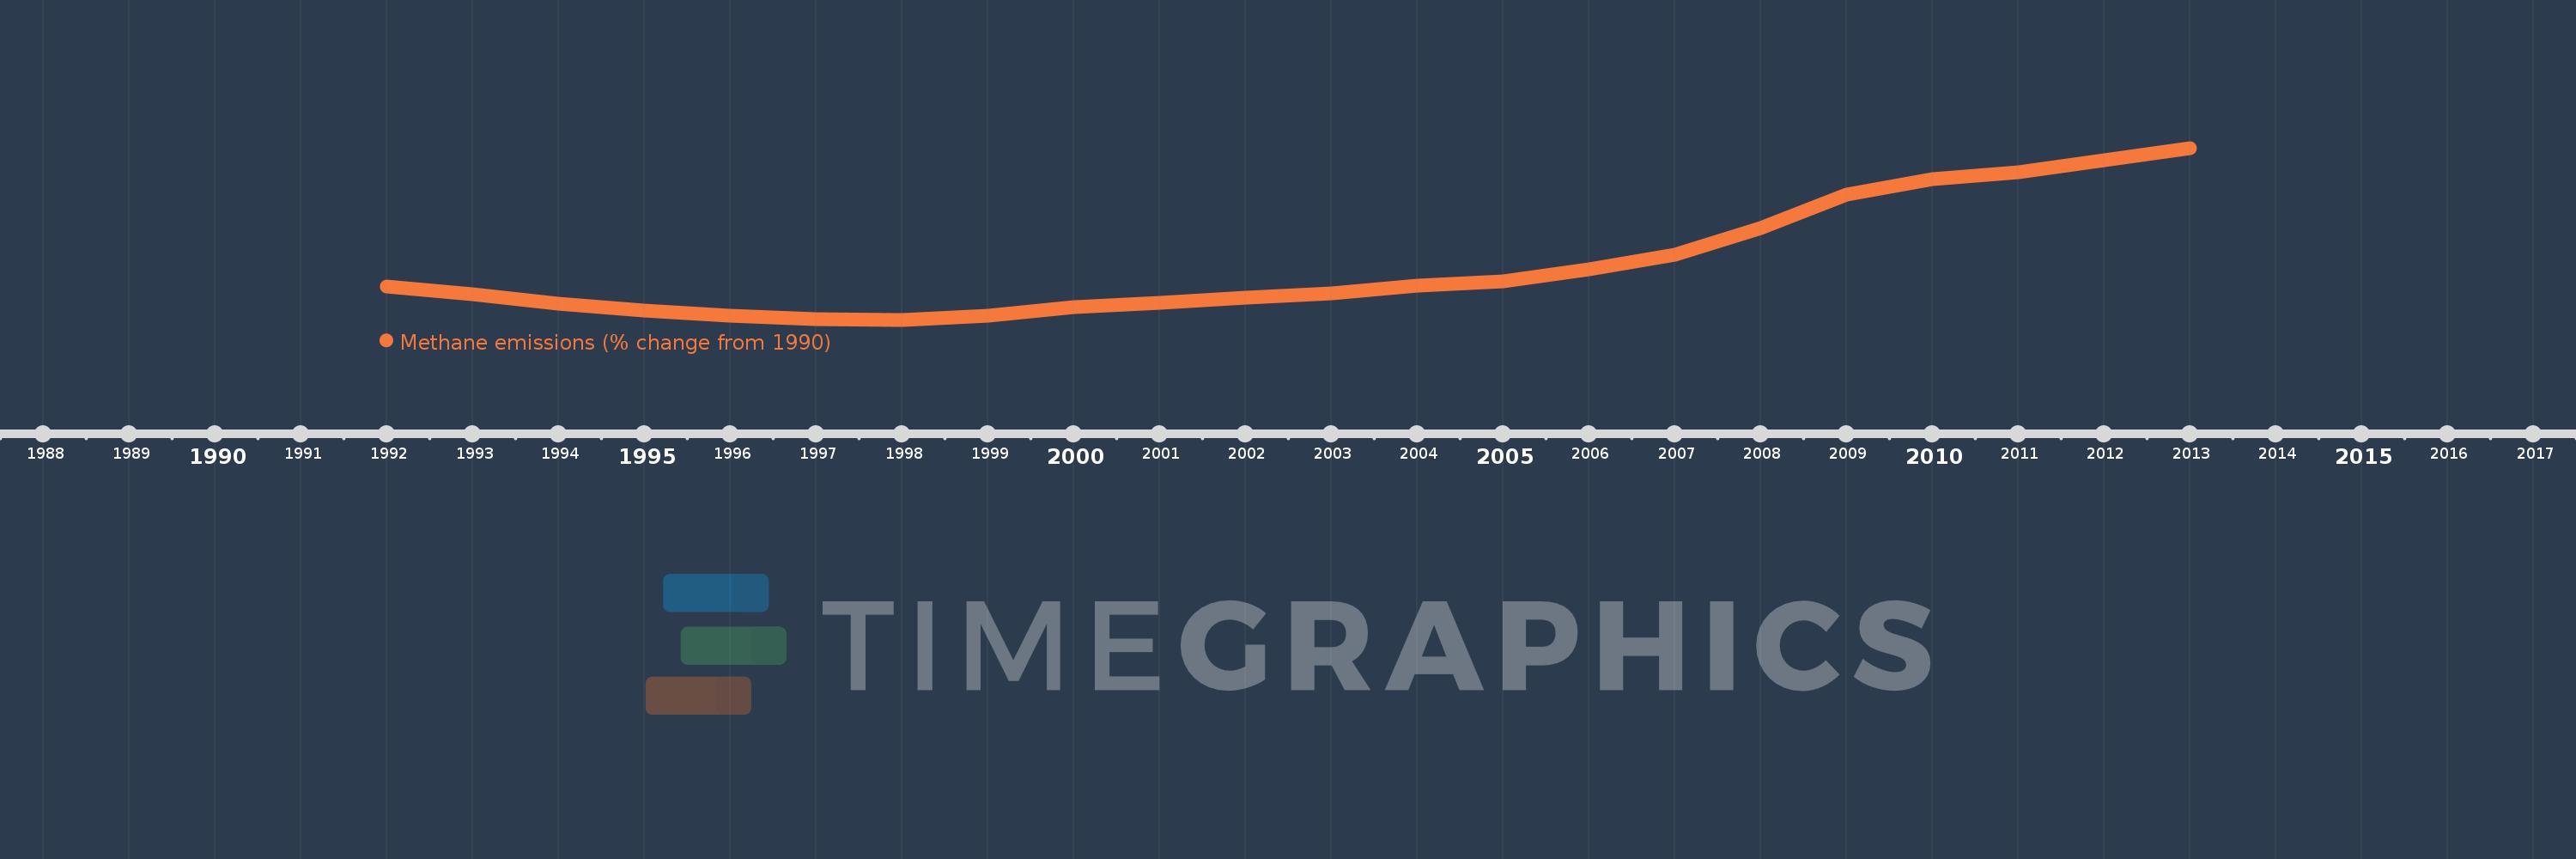
This timeline shows a graph from 1992 to 2013 of Azerbaijan. No data until 1991. Number of actual observations by date: 22.
Source name:
World Development Indicators
Source organization:
World Bank staff estimates from original source: European Commission, Joint Research Centre (JRC)/Netherlands Environmental Assessment Agency (PBL). Emission Database for Global Atmospheric Research (EDGAR): http://edgar.jrc.ec.europa.eu/.
Categories, topics:
Climate Change, Environment
Last updated:
apr 23, 2017
Indicators value changes by year
Meaning:
7.984
Minimum:
-22.541
jan 1, 1998
Maximum:
74.153
jan 1, 2013
At the date of observation
Value
Absolute change
Change from the previous value
jan 1, 1992
-3.603
-3.603
0.0%
jan 1, 1993
-8.408
-4.805
133.38%
jan 1, 1994
-13.614
-5.206
61.92%
jan 1, 1995
-17.324
-3.71
27.25%
jan 1, 1996
-20.43
-3.106
17.93%
jan 1, 1997
-22.343
-1.912
9.36%
jan 1, 1998
-22.541
-0.198
0.89%
jan 1, 1999
-20.431
+2.11
-9.36%
jan 1, 2000
-15.346
+5.085
-24.89%
jan 1, 2001
-13.124
+2.222
-14.48%
jan 1, 2002
-10.336
+2.789
-21.25%
jan 1, 2003
-7.63
+2.705
-26.18%
jan 1, 2004
-3.479
+4.152
-54.41%
jan 1, 2005
-1.116
+2.362
-67.91%
jan 1, 2006
5.619
+6.735
-603.36%
jan 1, 2007
14.126
+8.507
151.41%
jan 1, 2008
29.221
+15.095
106.86%
jan 1, 2009
47.889
+18.668
63.89%
jan 1, 2010
56.41
+8.52
17.79%
jan 1, 2011
60.584
+4.174
7.4%
jan 1, 2012
67.368
+6.785
11.2%
jan 1, 2013
74.153
+6.785
10.07%
Ranking of countries by current statistics by years
