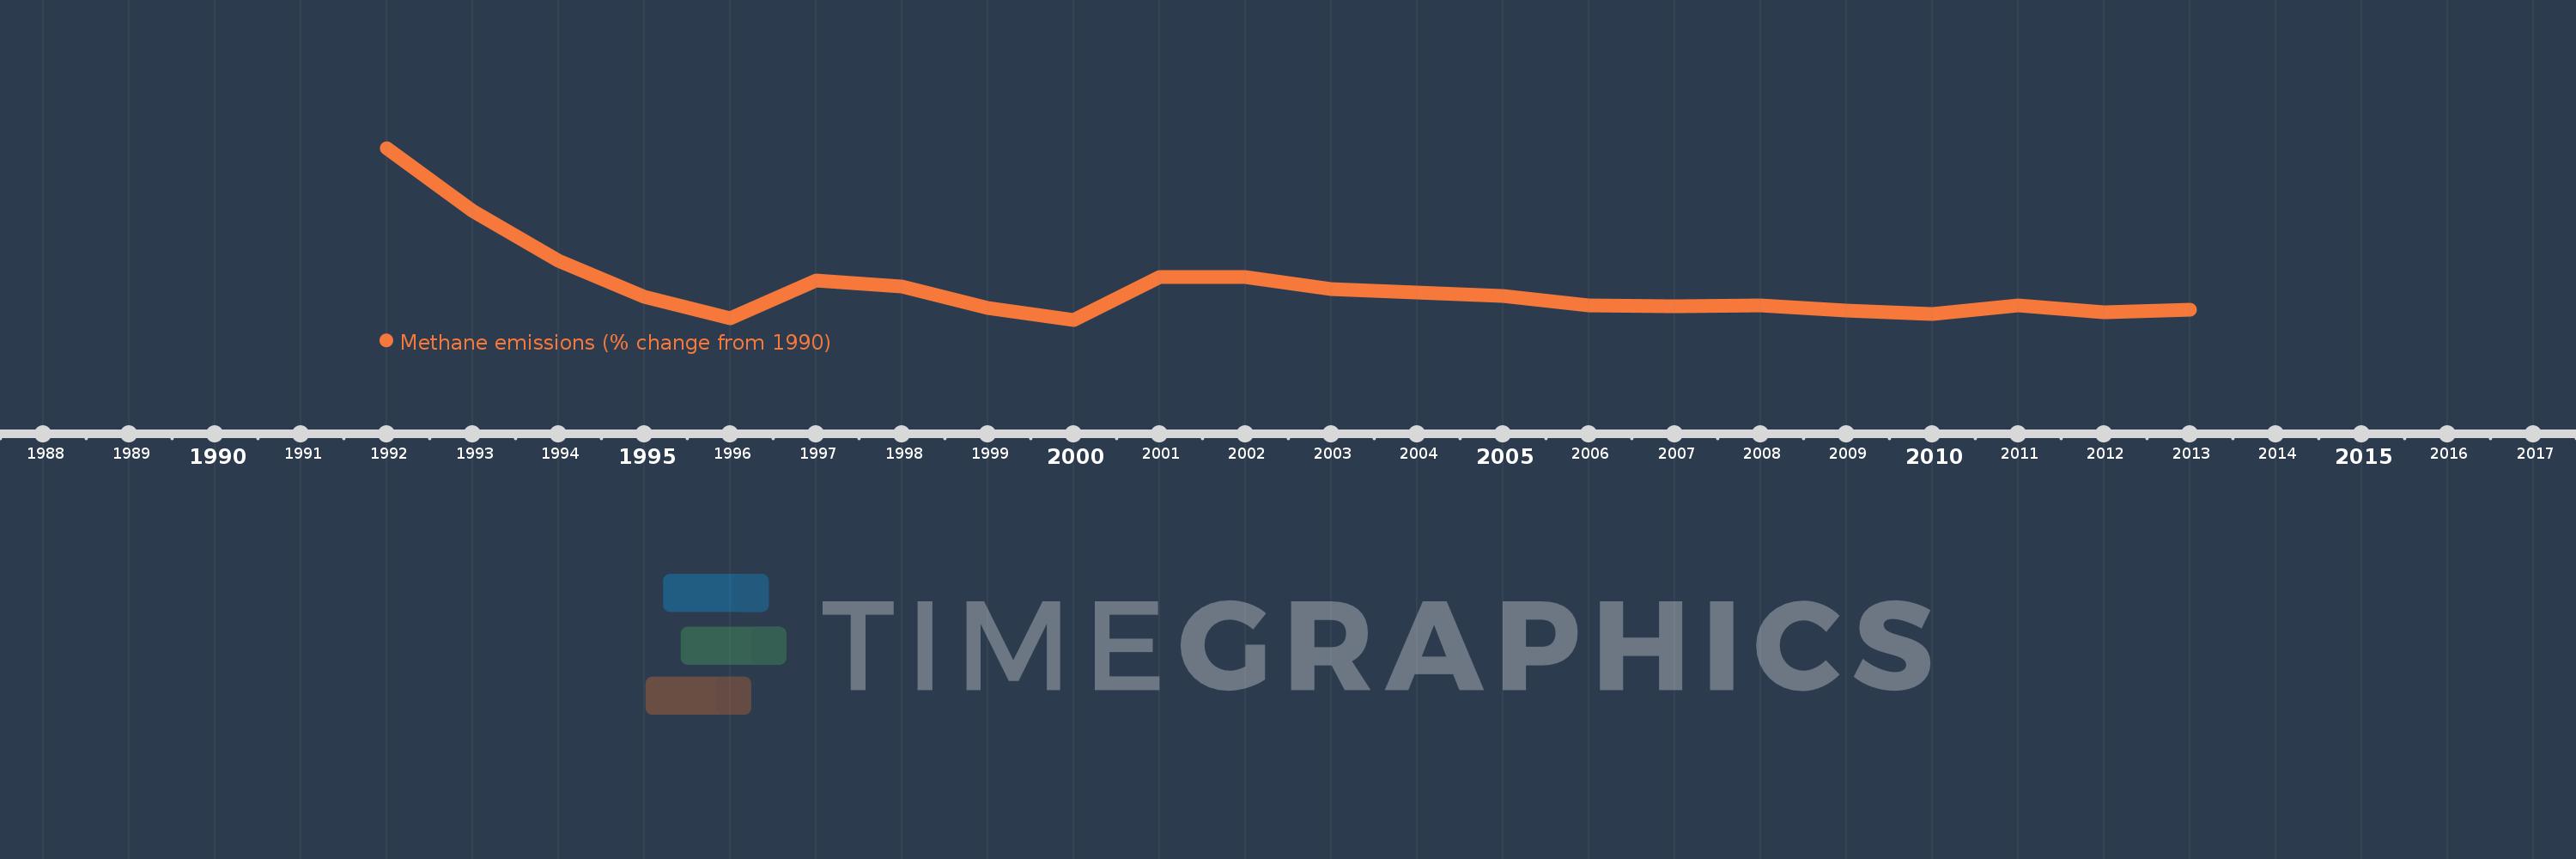
This timeline shows a graph from 1992 to 2013 of Czech Republic. No data until 1991. Number of actual observations by date: 22.
Source name:
World Development Indicators
Source organization:
World Bank staff estimates from original source: European Commission, Joint Research Centre (JRC)/Netherlands Environmental Assessment Agency (PBL). Emission Database for Global Atmospheric Research (EDGAR): http://edgar.jrc.ec.europa.eu/.
Categories, topics:
Climate Change, Environment
Last updated:
apr 23, 2017
Indicators value changes by year
Meaning:
-30.922
Minimum:
-36.481
jan 1, 2000
Maximum:
-6.62
jan 1, 1992
At the date of observation
Value
Absolute change
Change from the previous value
jan 1, 1992
-6.62
-6.62
0.0%
jan 1, 1993
-17.572
-10.952
165.43%
jan 1, 1994
-26.245
-8.673
49.35%
jan 1, 1995
-32.507
-6.263
23.86%
jan 1, 1996
-36.19
-3.682
11.33%
jan 1, 1997
-29.728
+6.462
-17.86%
jan 1, 1998
-30.742
-1.014
3.41%
jan 1, 1999
-34.426
-3.684
11.98%
jan 1, 2000
-36.481
-2.056
5.97%
jan 1, 2001
-28.992
+7.489
-20.53%
jan 1, 2002
-29.018
-0.026
0.09%
jan 1, 2003
-31.193
-2.175
7.49%
jan 1, 2004
-31.805
-0.612
1.96%
jan 1, 2005
-32.306
-0.501
1.57%
jan 1, 2006
-33.941
-1.635
5.06%
jan 1, 2007
-34.204
-0.263
0.78%
jan 1, 2008
-33.932
+0.272
-0.8%
jan 1, 2009
-34.953
-1.022
3.01%
jan 1, 2010
-35.472
-0.518
1.48%
jan 1, 2011
-34.053
+1.418
-4.0%
jan 1, 2012
-35.123
-1.07
3.14%
jan 1, 2013
-34.774
+0.349
-0.99%
Ranking of countries by current statistics by years
