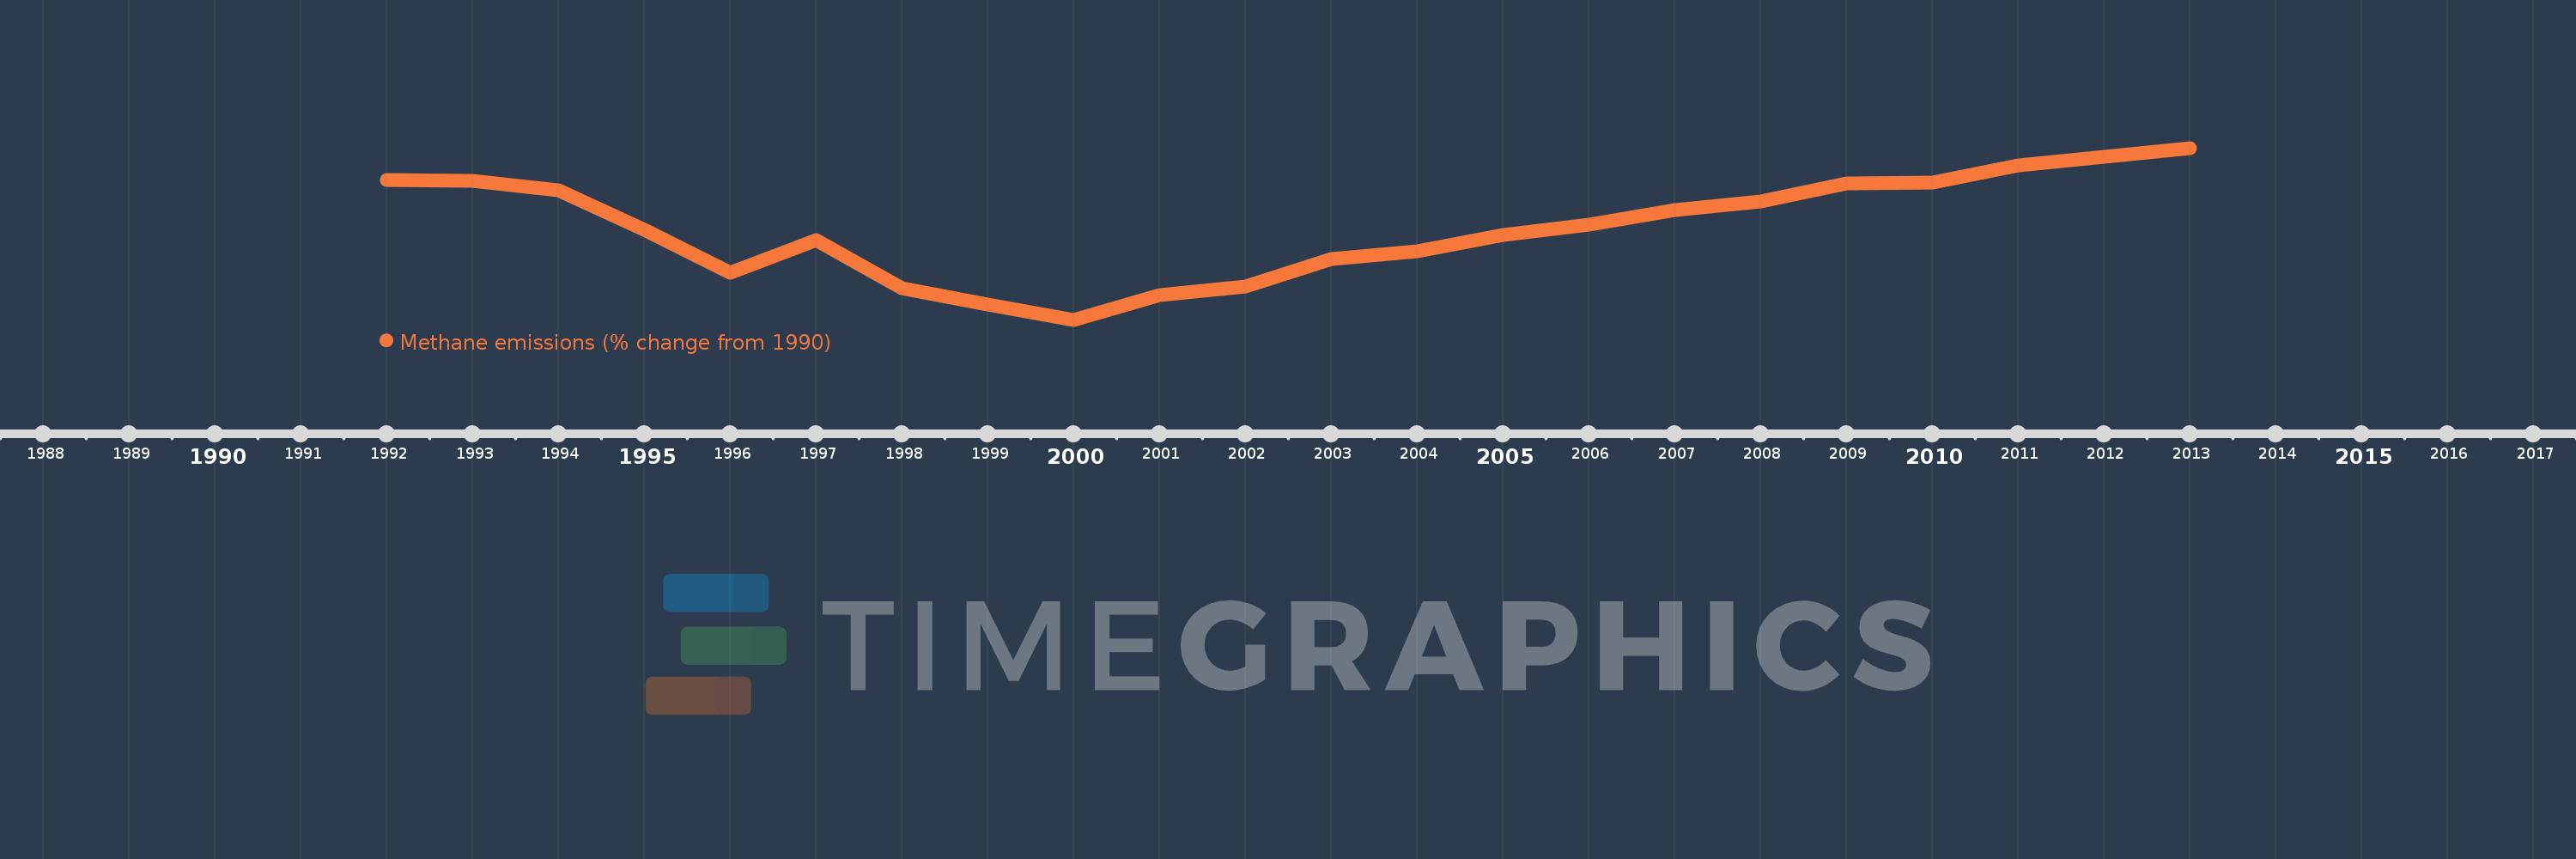
This timeline shows a graph from 1992 to 2013 of Kazakhstan. No data until 1991. Number of actual observations by date: 22.
Source name:
World Development Indicators
Source organization:
World Bank staff estimates from original source: European Commission, Joint Research Centre (JRC)/Netherlands Environmental Assessment Agency (PBL). Emission Database for Global Atmospheric Research (EDGAR): http://edgar.jrc.ec.europa.eu/.
Categories, topics:
Climate Change, Environment
Last updated:
apr 23, 2017
Indicators value changes by year
Meaning:
-22.616
Minimum:
-52.094
jan 1, 2000
Maximum:
2.792
jan 1, 2013
At the date of observation
Value
Absolute change
Change from the previous value
jan 1, 1992
-7.505
-7.505
0.0%
jan 1, 1993
-7.712
-0.206
2.75%
jan 1, 1994
-10.784
-3.072
39.83%
jan 1, 1995
-23.471
-12.687
117.65%
jan 1, 1996
-37.094
-13.623
58.04%
jan 1, 1997
-26.522
+10.572
-28.5%
jan 1, 1998
-41.963
-15.441
58.22%
jan 1, 1999
-47.357
-5.394
12.85%
jan 1, 2000
-52.094
-4.737
10.0%
jan 1, 2001
-44.133
+7.961
-15.28%
jan 1, 2002
-41.582
+2.551
-5.78%
jan 1, 2003
-32.569
+9.014
-21.68%
jan 1, 2004
-30.166
+2.403
-7.38%
jan 1, 2005
-25.059
+5.107
-16.93%
jan 1, 2006
-21.709
+3.35
-13.37%
jan 1, 2007
-16.999
+4.711
-21.7%
jan 1, 2008
-14.398
+2.601
-15.3%
jan 1, 2009
-8.435
+5.962
-41.41%
jan 1, 2010
-8.136
+0.299
-3.55%
jan 1, 2011
-2.694
+5.442
-66.88%
jan 1, 2012
0.049
+2.743
-101.81%
jan 1, 2013
2.792
+2.743
5.64K%
Ranking of countries by current statistics by years
