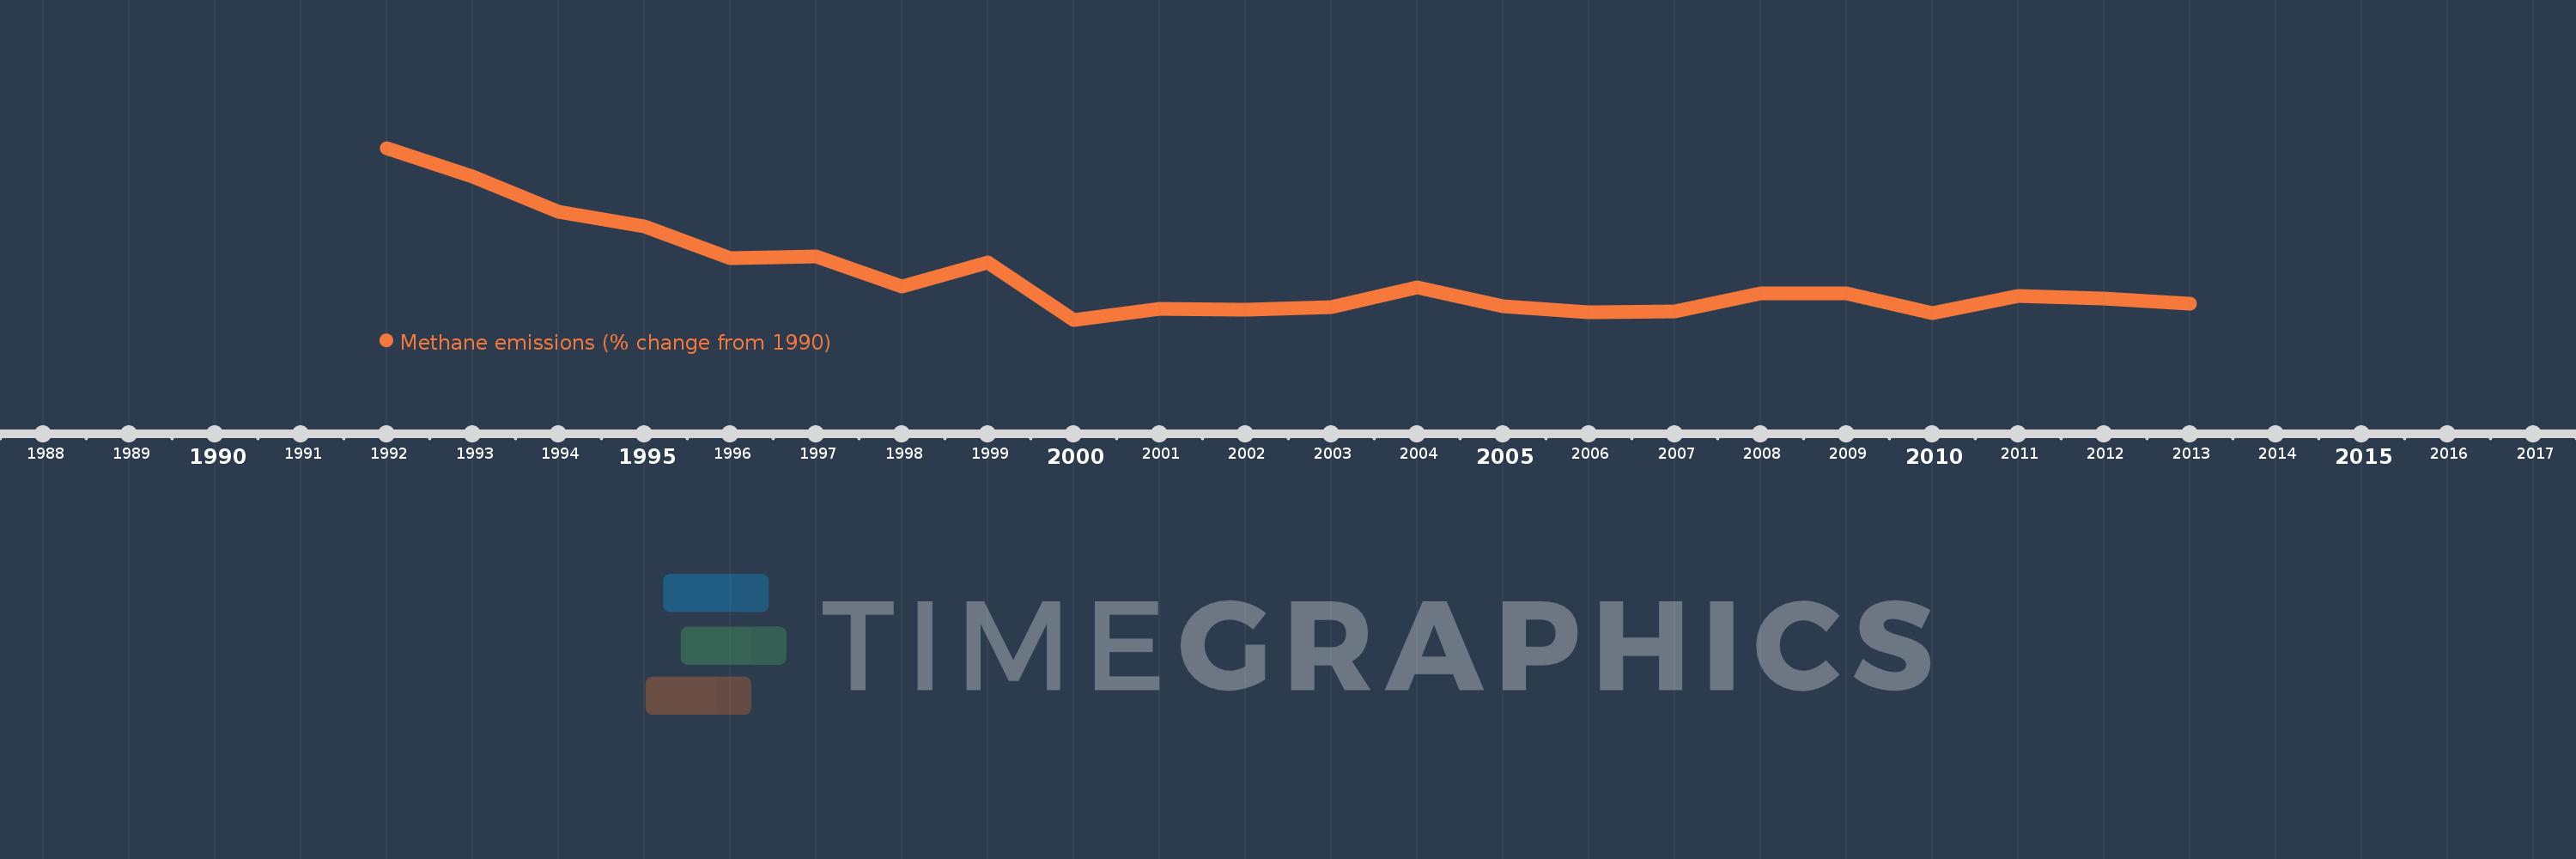
This timeline shows a graph from 1992 to 2013 of High income. No data until 1991. Number of actual observations by date: 22.
Source name:
World Development Indicators
Source organization:
World Bank staff estimates from original source: European Commission, Joint Research Centre (JRC)/Netherlands Environmental Assessment Agency (PBL). Emission Database for Global Atmospheric Research (EDGAR): http://edgar.jrc.ec.europa.eu/.
Categories, topics:
Climate Change, Environment
Last updated:
apr 23, 2017
Indicators value changes by year
Meaning:
-8.753
Minimum:
-11.216
jan 1, 2000
Maximum:
-1.386
jan 1, 1992
At the date of observation
Value
Absolute change
Change from the previous value
jan 1, 1992
-1.386
-1.386
0.0%
jan 1, 1993
-3.032
-1.646
118.81%
jan 1, 1994
-5.024
-1.993
65.72%
jan 1, 1995
-5.868
-0.844
16.79%
jan 1, 1996
-7.692
-1.824
31.08%
jan 1, 1997
-7.612
+0.08
-1.04%
jan 1, 1998
-9.329
-1.717
22.55%
jan 1, 1999
-7.951
+1.378
-14.77%
jan 1, 2000
-11.216
-3.265
41.07%
jan 1, 2001
-10.602
+0.614
-5.48%
jan 1, 2002
-10.658
-0.056
0.53%
jan 1, 2003
-10.482
+0.176
-1.65%
jan 1, 2004
-9.348
+1.134
-10.82%
jan 1, 2005
-10.455
-1.106
11.84%
jan 1, 2006
-10.809
-0.355
3.39%
jan 1, 2007
-10.741
+0.068
-0.63%
jan 1, 2008
-9.689
+1.052
-9.8%
jan 1, 2009
-9.709
-0.02
0.21%
jan 1, 2010
-10.815
-1.106
11.39%
jan 1, 2011
-9.863
+0.952
-8.8%
jan 1, 2012
-9.978
-0.114
1.16%
jan 1, 2013
-10.314
-0.336
3.37%
Ranking of countries by current statistics by years
