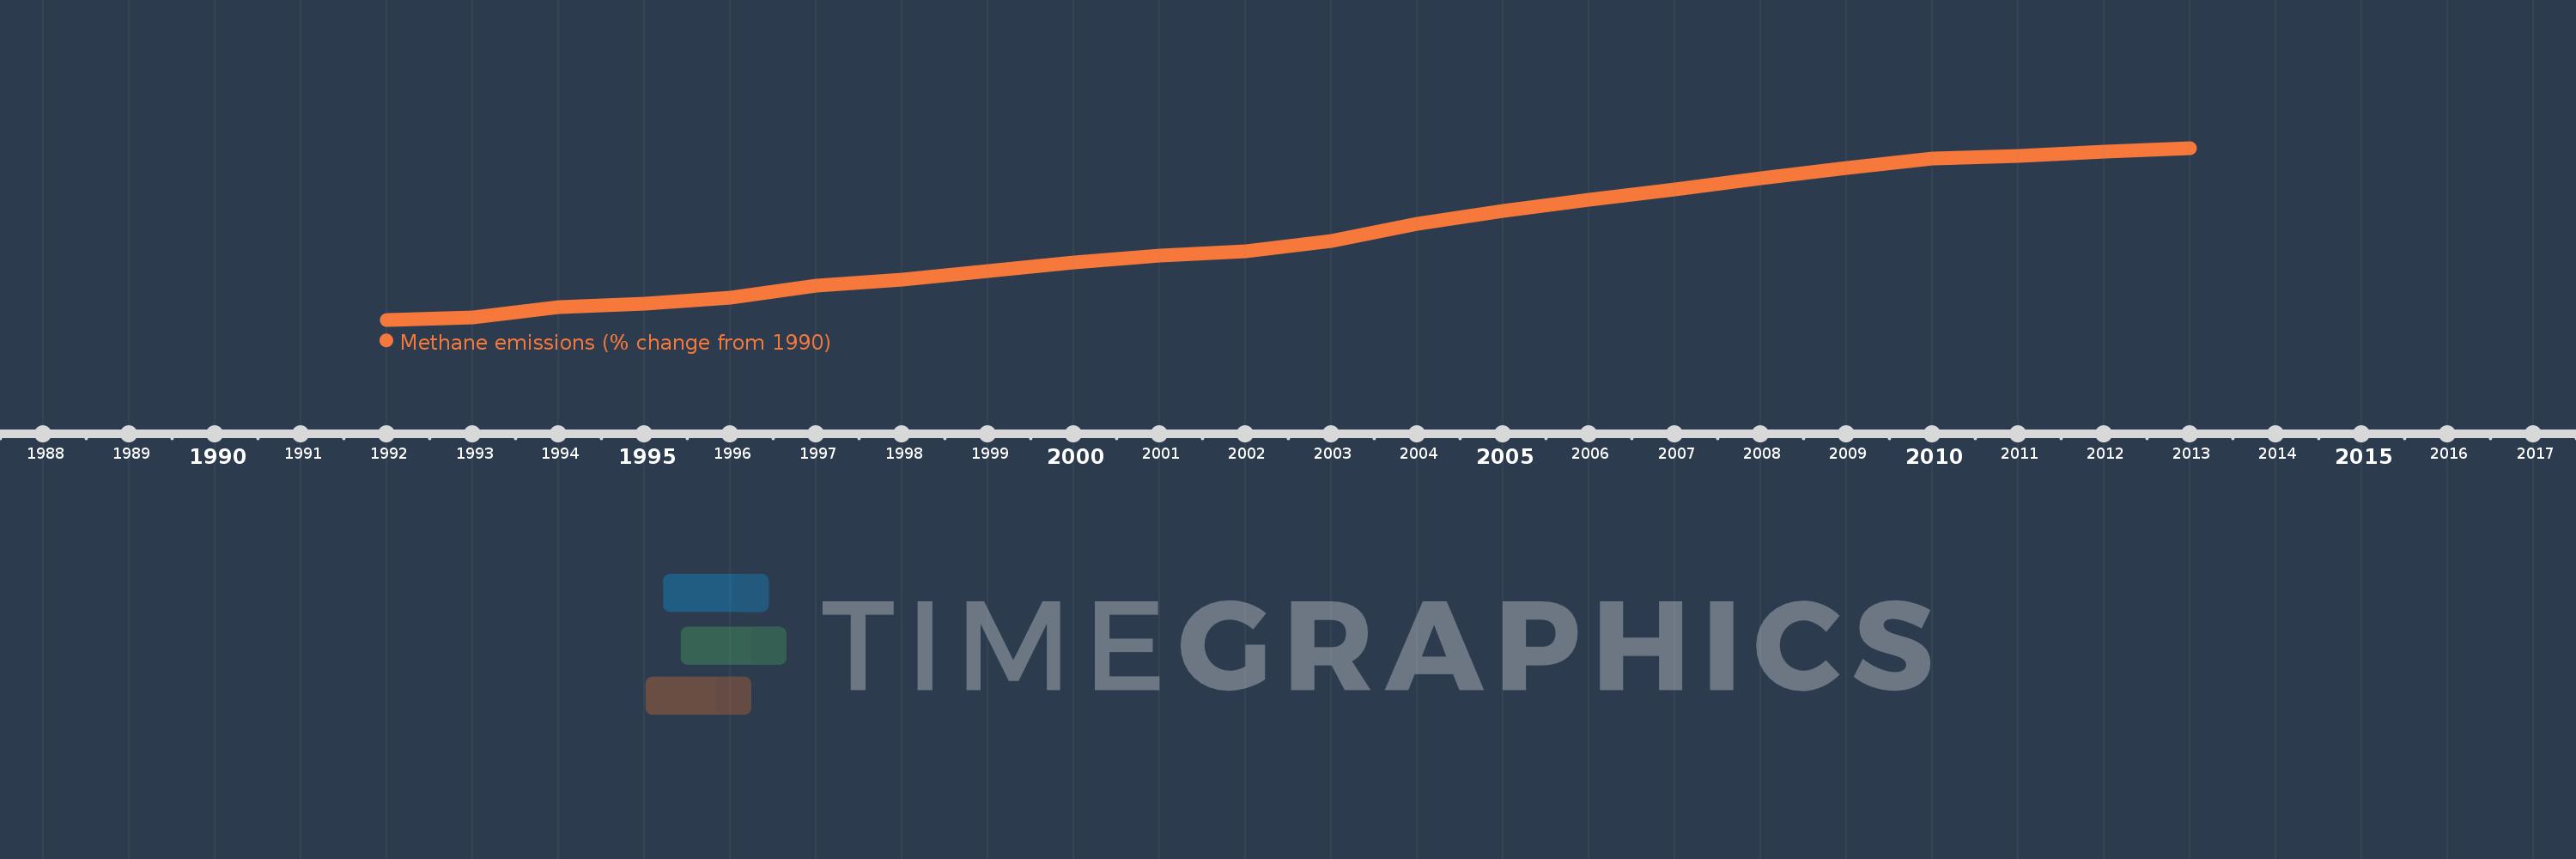
This timeline shows a graph from 1992 to 2013 of Pakistan. No data until 1991. Number of actual observations by date: 22.
Source name:
World Development Indicators
Source organization:
World Bank staff estimates from original source: European Commission, Joint Research Centre (JRC)/Netherlands Environmental Assessment Agency (PBL). Emission Database for Global Atmospheric Research (EDGAR): http://edgar.jrc.ec.europa.eu/.
Categories, topics:
Climate Change, Environment
Last updated:
apr 23, 2017
Indicators value changes by year
Meaning:
37.62
Minimum:
2.096
jan 1, 1992
Maximum:
74.365
jan 1, 2013
At the date of observation
Value
Absolute change
Change from the previous value
jan 1, 1992
2.096
+2.096
0.0%
jan 1, 1993
3.058
+0.962
45.9%
jan 1, 1994
7.281
+4.223
138.12%
jan 1, 1995
8.779
+1.498
20.58%
jan 1, 1996
11.449
+2.669
30.41%
jan 1, 1997
16.336
+4.887
42.69%
jan 1, 1998
19.078
+2.742
16.79%
jan 1, 1999
22.531
+3.453
18.1%
jan 1, 2000
26.211
+3.679
16.33%
jan 1, 2001
28.981
+2.771
10.57%
jan 1, 2002
31.063
+2.081
7.18%
jan 1, 2003
35.337
+4.275
13.76%
jan 1, 2004
42.509
+7.171
20.29%
jan 1, 2005
47.865
+5.356
12.6%
jan 1, 2006
52.712
+4.846
10.13%
jan 1, 2007
56.737
+4.025
7.64%
jan 1, 2008
61.787
+5.05
8.9%
jan 1, 2009
65.897
+4.11
6.65%
jan 1, 2010
69.981
+4.084
6.2%
jan 1, 2011
70.946
+0.965
1.38%
jan 1, 2012
72.655
+1.709
2.41%
jan 1, 2013
74.365
+1.709
2.35%
Ranking of countries by current statistics by years
