30
/
AIzaSyAYiBZKx7MnpbEhh9jyipgxe19OcubqV5w
April 1, 2024
63556
Afghanistan
AFG
true
2
1
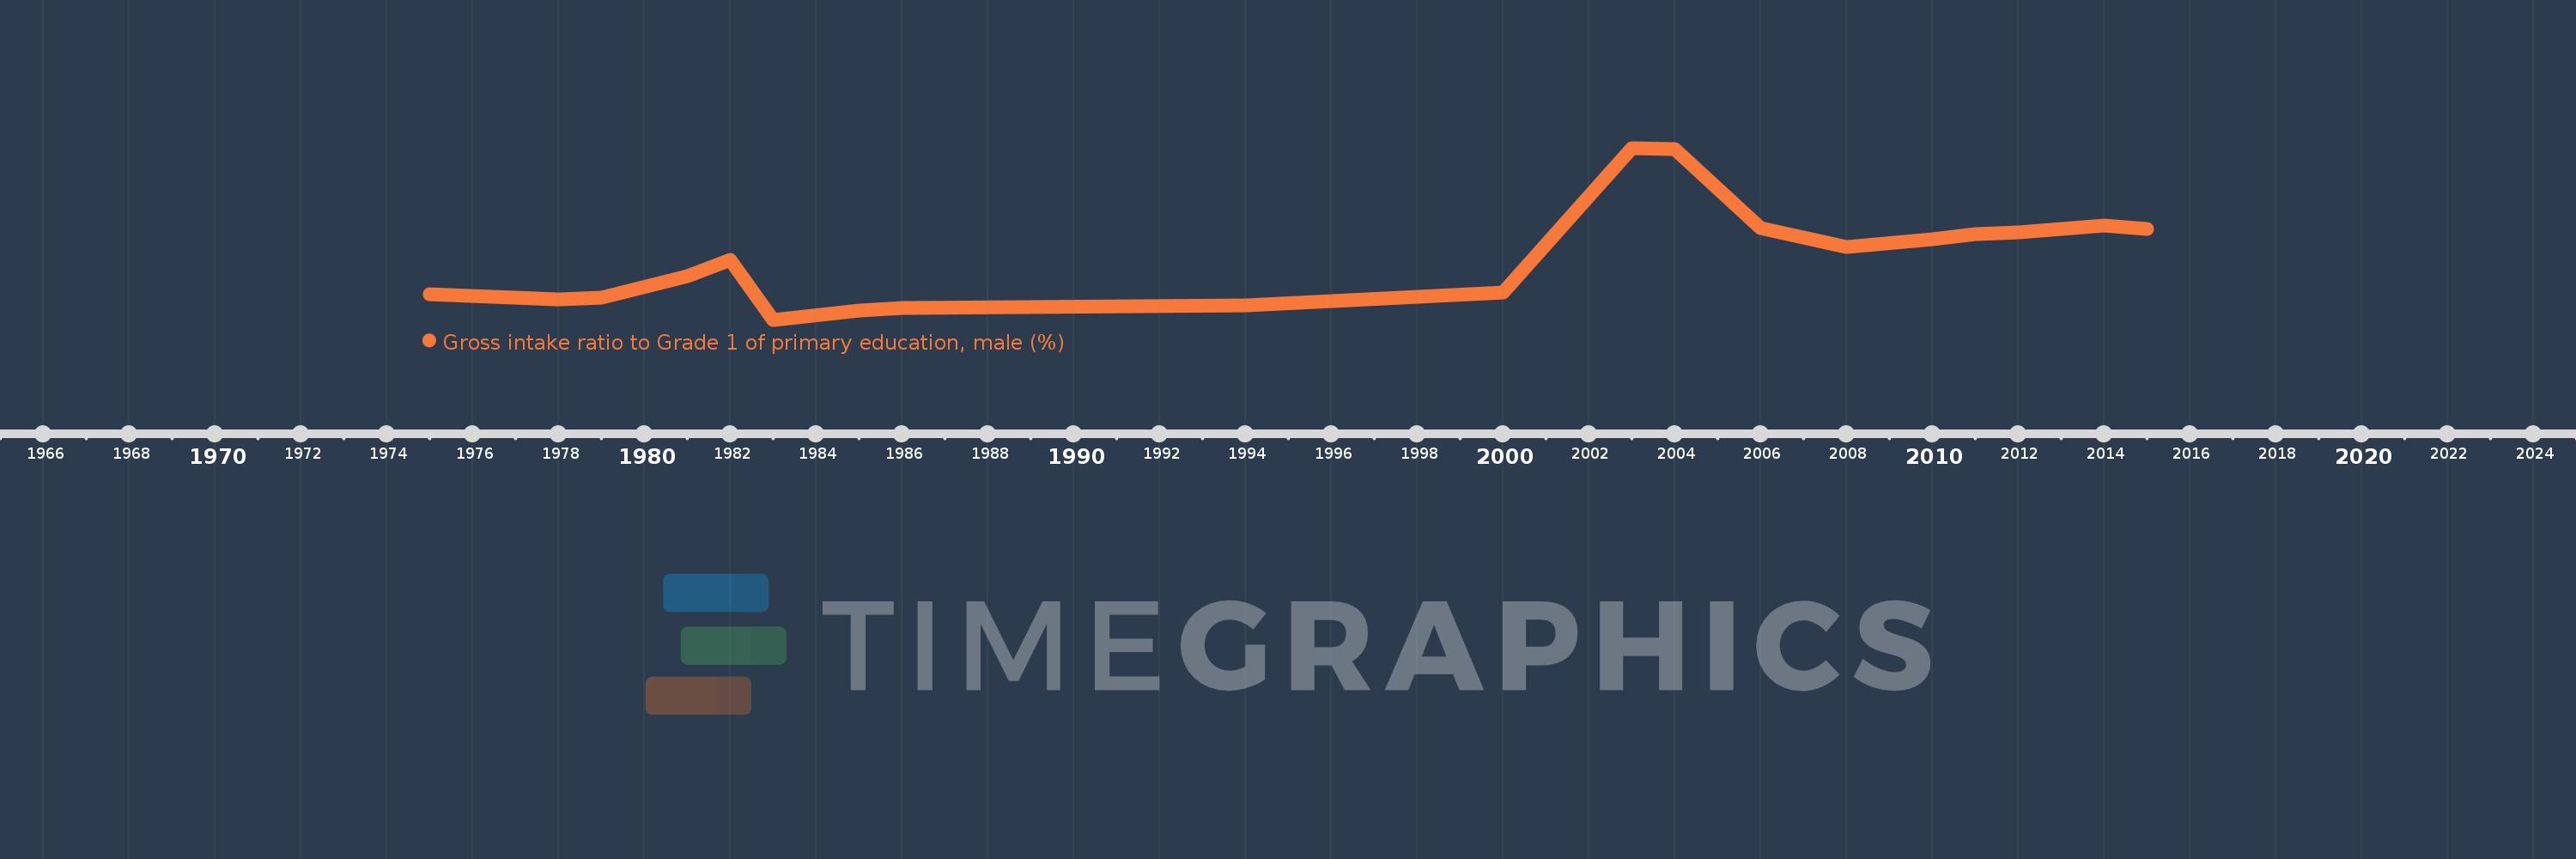
Gross intake ratio to Grade 1 of primary education, male (%)
2015,2014,2013,2012,2011,2010,2008,2006,2004,2003,2000,1994,1986,1985,1983,1982,1981,1979,1978,1975
