29
/
en
AIzaSyAYiBZKx7MnpbEhh9jyipgxe19OcubqV5w
April 1, 2024
148005
Guyana
GUY
true
2
1
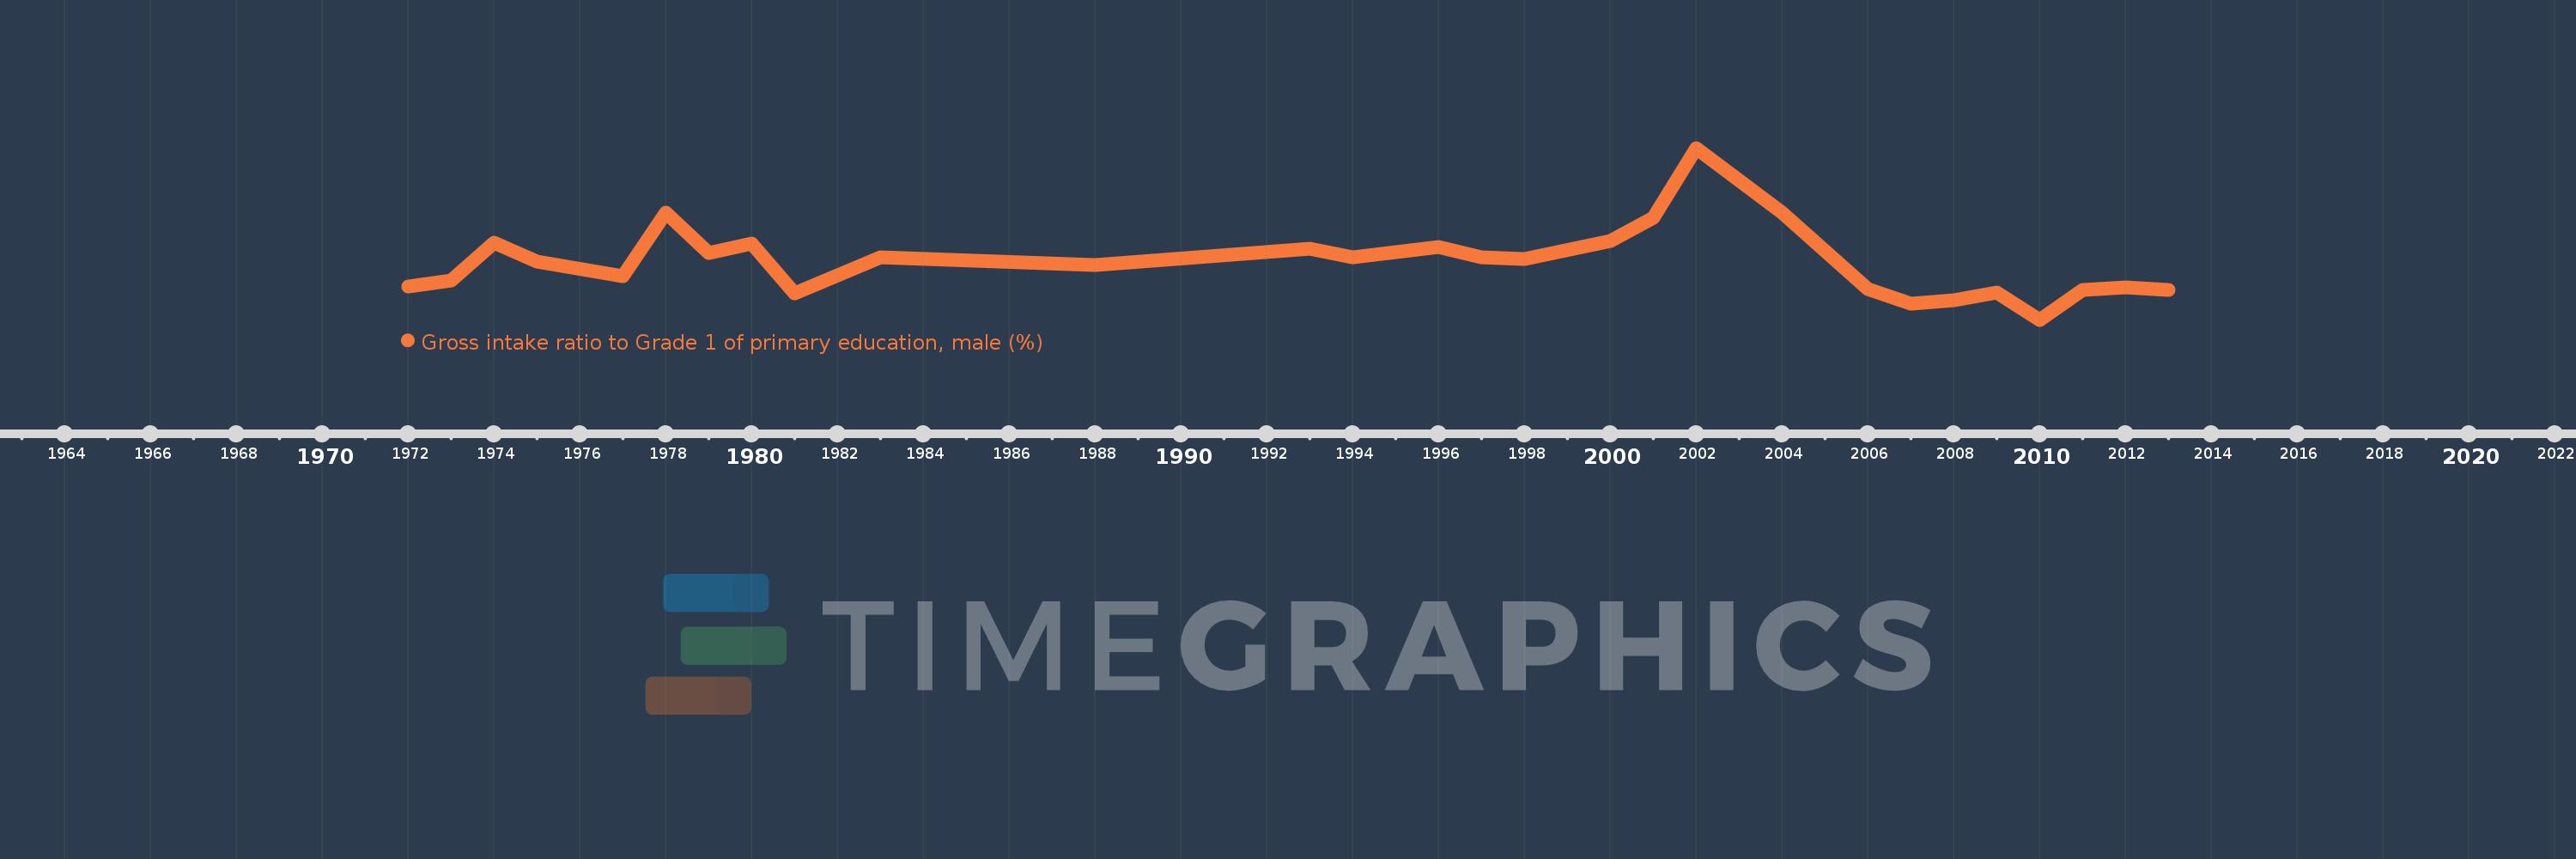
Gross intake ratio to Grade 1 of primary education, male (%)
2013,2012,2011,2010,2009,2008,2007,2006,2004,2002,2001,2000,1998,1997,1996,1994,1993,1988,1983,1981,1980,1979,1978,1977,1975,1974,1973,1972
This statistics in other country:
AfghanistanAlbaniaAlgeriaAngolaAntigua and BarbudaArab WorldArgentinaArmeniaArubaAustriaAzerbaijanBahamas, TheBahrainBangladeshBarbadosBelarusBelgiumBelizeBeninBermudaBhutanBoliviaBosnia and HerzegovinaBotswanaBrazilBrunei DarussalamBulgariaBurkina FasoBurundiCabo VerdeCambodiaCameroonCanadaCaribbean small statesCentral African RepublicCentral Europe and the BalticsChadChileChinaColombiaComorosCongo, Dem. Rep.Congo, Rep.Costa RicaCote d'IvoireCroatiaCubaCyprusCzech RepublicDenmarkDjiboutiDominicaDominican RepublicEarly-demographic dividendEast Asia & PacificEast Asia & Pacific (excluding high income)East Asia & Pacific (IDA & IBRD countries)EcuadorEgypt, Arab Rep.El SalvadorEquatorial GuineaEritreaEstoniaEthiopiaEuro areaEurope & Central AsiaEurope & Central Asia (excluding high income)Europe & Central Asia (IDA & IBRD countries)European UnionFijiFinlandFragile and conflict affected situationsFranceGabonGambia, TheGeorgiaGermanyGhanaGreeceGrenadaGuatemalaGuineaGuinea-BissauGuyanaHaitiHeavily indebted poor countries (HIPC)High incomeHondurasHong Kong SAR, ChinaHungaryIBRD onlyIcelandIDA & IBRD totalIDA blendIDA onlyIDA totalIndiaIndonesiaIran, Islamic Rep.IraqIrelandIsraelItalyJamaicaJapanJordanKazakhstanKenyaKiribatiKorea, Dem. People’s Rep.Korea, Rep.KuwaitKyrgyz RepublicLao PDRLate-demographic dividendLatin America & Caribbean Latin America & Caribbean (excluding high income)Latin America & the Caribbean (IDA & IBRD countries)LatviaLeast developed countries: UN classificationLebanonLesothoLiberiaLibyaLiechtensteinLithuaniaLow & middle incomeLow incomeLower middle incomeLuxembourgMacao SAR, ChinaMacedonia, FYRMadagascarMalawiMaldivesMaliMaltaMarshall IslandsMauritaniaMauritiusMexicoMicronesia, Fed. Sts.Middle East & North AfricaMiddle East & North Africa (excluding high income)Middle East & North Africa (IDA & IBRD countries)Middle incomeMoldovaMongoliaMontenegroMoroccoMozambiqueMyanmarNamibiaNauruNepalNetherlandsNew ZealandNicaraguaNigerNigeriaNorth AmericaNorwayOECD membersOmanOther small statesPacific island small statesPakistanPalauPanamaPapua New GuineaParaguayPeruPhilippinesPolandPortugalPost-demographic dividendPre-demographic dividendPuerto RicoQatarRomaniaRussian FederationRwandaSamoaSan MarinoSao Tome and PrincipeSaudi ArabiaSenegalSerbiaSeychellesSierra LeoneSlovak RepublicSloveniaSmall statesSolomon IslandsSouth AfricaSouth AsiaSouth Asia (IDA & IBRD)South SudanSpainSri LankaSt. Kitts and NevisSt. LuciaSt. Vincent and the GrenadinesSub-Saharan Africa Sub-Saharan Africa (excluding high income)Sub-Saharan Africa (IDA & IBRD countries)SudanSurinameSwazilandSwedenSwitzerlandSyrian Arab RepublicTajikistanTanzaniaThailandTimor-LesteTogoTongaTrinidad and TobagoTunisiaTurkeyTuvaluUgandaUkraineUnited Arab EmiratesUnited StatesUpper middle incomeUruguayUzbekistanVanuatuVenezuela, RBVietnamWest Bank and GazaWorldYemen, Rep.ZambiaZimbabwe Timeline:
This timeline shows a graph from 1972 to 2013 of Guyana. No data until 1971. Number of actual observations by date: 28.
Source name:
World Development Indicators
Source organization:
UNESCO Institute for Statistics
Categories, topics:
Education, Gender
Last updated:
apr 23, 2017
Indicators value changes by year
Minimum:
77.603
jan 1, 2010
Maximum:
130.781
jan 1, 2002
At the date of observation
Value
Absolute change
Change from previous value
jan 1, 1972
87.804
+87.804
0.0%
jan 1, 1973
89.823
+2.019
2.3%
jan 1, 1974
101.459
+11.636
12.95%
jan 1, 1975
95.568
-5.89
-5.81%
jan 1, 1977
91.158
-4.41
-4.61%
jan 1, 1978
110.747
+19.589
21.49%
jan 1, 1979
98.251
-12.496
-11.28%
jan 1, 1980
101.112
+2.861
2.91%
jan 1, 1981
85.695
-15.416
-15.25%
jan 1, 1983
96.958
+11.263
13.14%
jan 1, 1988
94.514
-2.444
-2.52%
jan 1, 1993
99.545
+5.031
5.32%
jan 1, 1994
97.043
-2.503
-2.51%
jan 1, 1996
100.023
+2.98
3.07%
jan 1, 1997
96.801
-3.222
-3.22%
jan 1, 1998
96.487
-0.314
-0.32%
jan 1, 2000
102.015
+5.527
5.73%
jan 1, 2001
109.274
+7.26
7.12%
jan 1, 2002
130.781
+21.507
19.68%
jan 1, 2004
110.739
-20.043
-15.33%
jan 1, 2006
87.08
-23.659
-21.36%
jan 1, 2007
82.458
-4.622
-5.31%
jan 1, 2008
83.687
+1.229
1.49%
jan 1, 2009
85.978
+2.291
2.74%
jan 1, 2010
77.603
-8.375
-9.74%
jan 1, 2011
86.881
+9.278
11.96%
jan 1, 2012
87.563
+0.683
0.79%
jan 1, 2013
86.827
-0.736
-0.84%
Ranking of countries by current statistics by years


Comments: