29
/
en
AIzaSyAYiBZKx7MnpbEhh9jyipgxe19OcubqV5w
April 1, 2024
99987
Cameroon
CMR
true
2
1
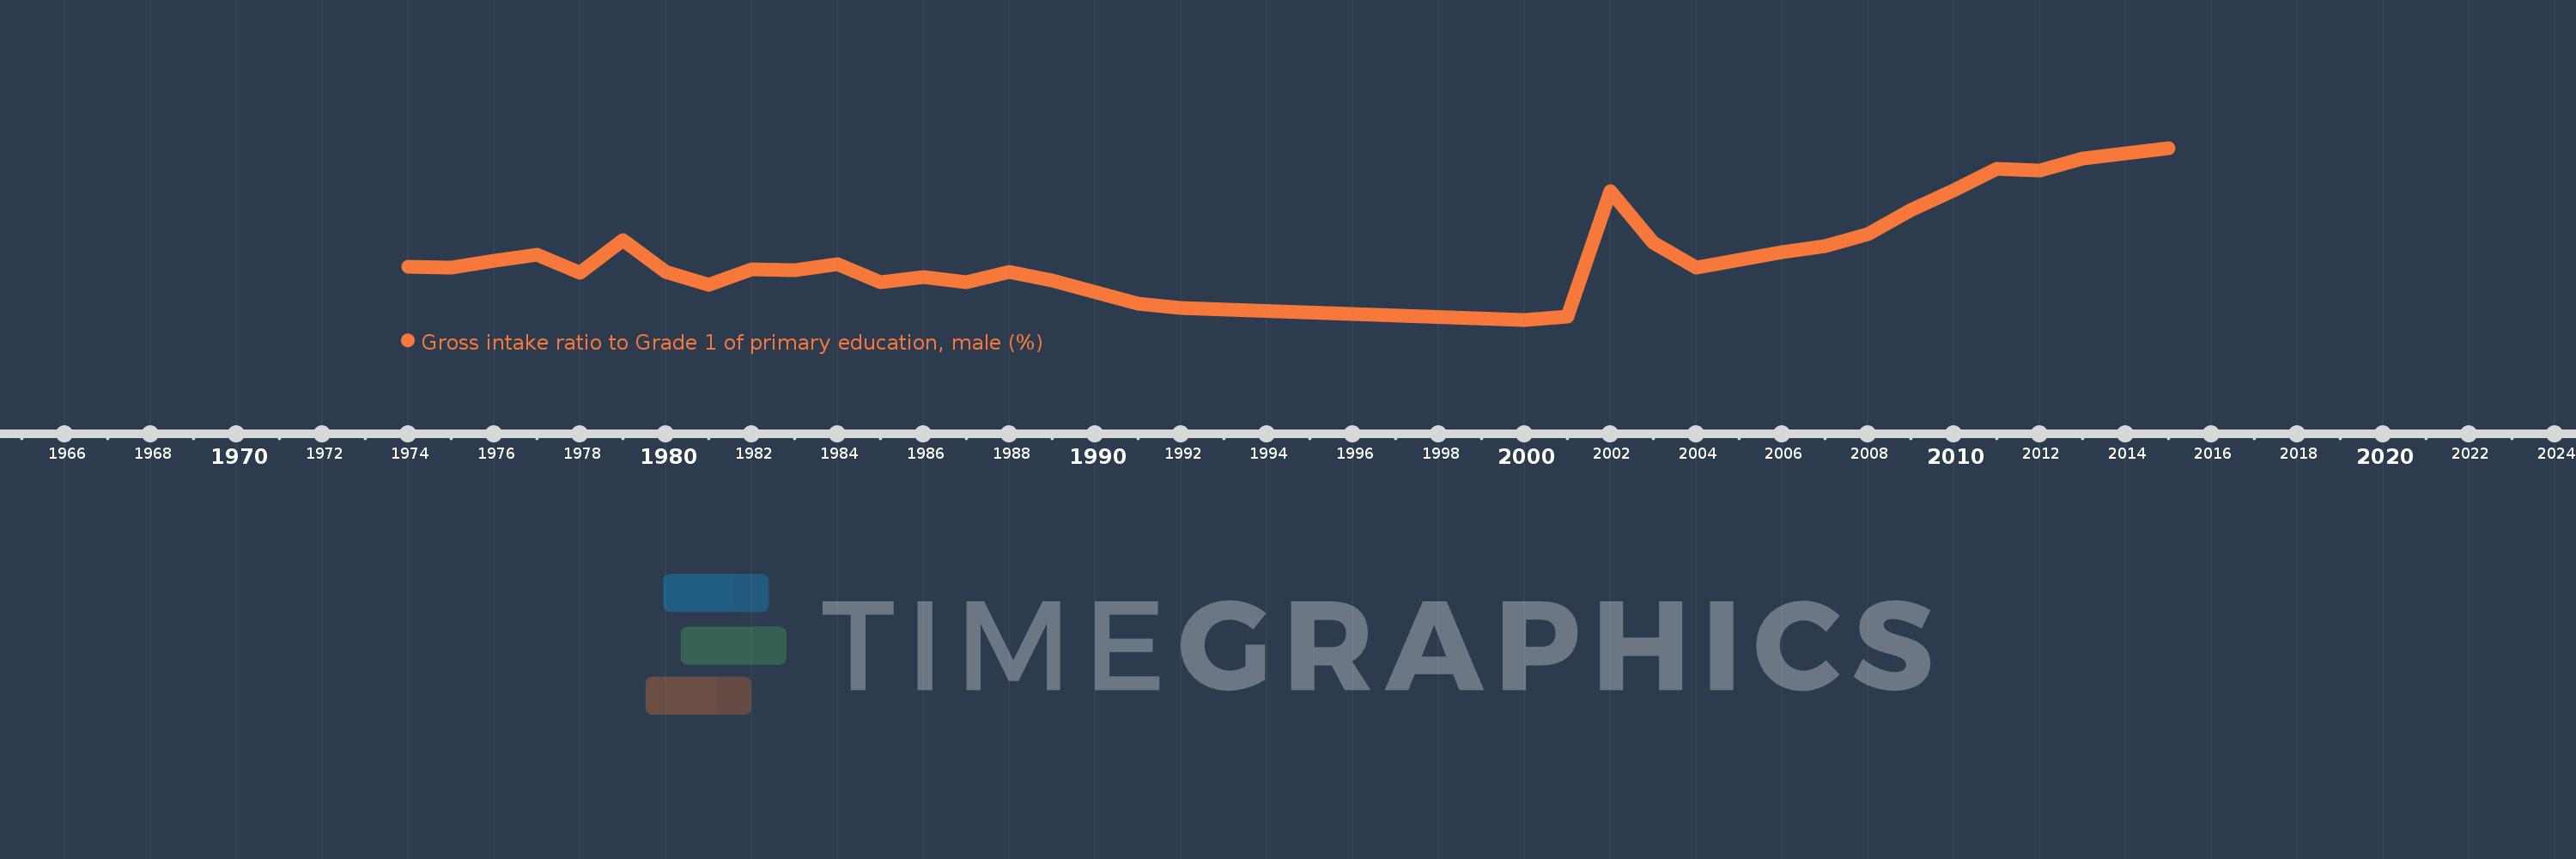
Gross intake ratio to Grade 1 of primary education, male (%)
2015,2013,2012,2011,2010,2009,2008,2007,2006,2005,2004,2003,2002,2001,2000,1992,1991,1989,1988,1987,1986,1985,1984,1983,1982,1981,1980,1979,1978,1977,1976,1975,1974
This statistics in other country:
AfghanistanAlbaniaAlgeriaAngolaAntigua and BarbudaArab WorldArgentinaArmeniaArubaAustriaAzerbaijanBahamas, TheBahrainBangladeshBarbadosBelarusBelgiumBelizeBeninBermudaBhutanBoliviaBosnia and HerzegovinaBotswanaBrazilBrunei DarussalamBulgariaBurkina FasoBurundiCabo VerdeCambodiaCameroonCanadaCaribbean small statesCentral African RepublicCentral Europe and the BalticsChadChileChinaColombiaComorosCongo, Dem. Rep.Congo, Rep.Costa RicaCote d'IvoireCroatiaCubaCyprusCzech RepublicDenmarkDjiboutiDominicaDominican RepublicEarly-demographic dividendEast Asia & PacificEast Asia & Pacific (excluding high income)East Asia & Pacific (IDA & IBRD countries)EcuadorEgypt, Arab Rep.El SalvadorEquatorial GuineaEritreaEstoniaEthiopiaEuro areaEurope & Central AsiaEurope & Central Asia (excluding high income)Europe & Central Asia (IDA & IBRD countries)European UnionFijiFinlandFragile and conflict affected situationsFranceGabonGambia, TheGeorgiaGermanyGhanaGreeceGrenadaGuatemalaGuineaGuinea-BissauGuyanaHaitiHeavily indebted poor countries (HIPC)High incomeHondurasHong Kong SAR, ChinaHungaryIBRD onlyIcelandIDA & IBRD totalIDA blendIDA onlyIDA totalIndiaIndonesiaIran, Islamic Rep.IraqIrelandIsraelItalyJamaicaJapanJordanKazakhstanKenyaKiribatiKorea, Dem. People’s Rep.Korea, Rep.KuwaitKyrgyz RepublicLao PDRLate-demographic dividendLatin America & Caribbean Latin America & Caribbean (excluding high income)Latin America & the Caribbean (IDA & IBRD countries)LatviaLeast developed countries: UN classificationLebanonLesothoLiberiaLibyaLiechtensteinLithuaniaLow & middle incomeLow incomeLower middle incomeLuxembourgMacao SAR, ChinaMacedonia, FYRMadagascarMalawiMaldivesMaliMaltaMarshall IslandsMauritaniaMauritiusMexicoMicronesia, Fed. Sts.Middle East & North AfricaMiddle East & North Africa (excluding high income)Middle East & North Africa (IDA & IBRD countries)Middle incomeMoldovaMongoliaMontenegroMoroccoMozambiqueMyanmarNamibiaNauruNepalNetherlandsNew ZealandNicaraguaNigerNigeriaNorth AmericaNorwayOECD membersOmanOther small statesPacific island small statesPakistanPalauPanamaPapua New GuineaParaguayPeruPhilippinesPolandPortugalPost-demographic dividendPre-demographic dividendPuerto RicoQatarRomaniaRussian FederationRwandaSamoaSan MarinoSao Tome and PrincipeSaudi ArabiaSenegalSerbiaSeychellesSierra LeoneSlovak RepublicSloveniaSmall statesSolomon IslandsSouth AfricaSouth AsiaSouth Asia (IDA & IBRD)South SudanSpainSri LankaSt. Kitts and NevisSt. LuciaSt. Vincent and the GrenadinesSub-Saharan Africa Sub-Saharan Africa (excluding high income)Sub-Saharan Africa (IDA & IBRD countries)SudanSurinameSwazilandSwedenSwitzerlandSyrian Arab RepublicTajikistanTanzaniaThailandTimor-LesteTogoTongaTrinidad and TobagoTunisiaTurkeyTuvaluUgandaUkraineUnited Arab EmiratesUnited StatesUpper middle incomeUruguayUzbekistanVanuatuVenezuela, RBVietnamWest Bank and GazaWorldYemen, Rep.ZambiaZimbabwe Timeline:
This timeline shows a graph from 1974 to 2015 of Cameroon. No data until 1973. Number of actual observations by date: 33.
Source name:
World Development Indicators
Source organization:
UNESCO Institute for Statistics
Categories, topics:
Education, Gender
Last updated:
apr 23, 2017
Indicators value changes by year
Minimum:
78.412
jan 1, 2000
Maximum:
134.835
jan 1, 2015
At the date of observation
Value
Absolute change
Change from previous value
jan 1, 1974
95.792
+95.792
0.0%
jan 1, 1975
95.494
-0.298
-0.31%
jan 1, 1976
97.692
+2.198
2.3%
jan 1, 1977
99.711
+2.02
2.07%
jan 1, 1978
93.963
-5.749
-5.77%
jan 1, 1979
104.565
+10.603
11.28%
jan 1, 1980
94.093
-10.472
-10.01%
jan 1, 1981
89.924
-4.17
-4.43%
jan 1, 1982
94.878
+4.954
5.51%
jan 1, 1983
94.648
-0.229
-0.24%
jan 1, 1984
96.762
+2.114
2.23%
jan 1, 1985
90.803
-5.959
-6.16%
jan 1, 1986
92.33
+1.527
1.68%
jan 1, 1987
90.622
-1.708
-1.85%
jan 1, 1988
94.122
+3.5
3.86%
jan 1, 1989
91.264
-2.858
-3.04%
jan 1, 1991
83.59
-7.673
-8.41%
jan 1, 1992
82.416
-1.175
-1.41%
jan 1, 2000
78.412
-4.004
-4.86%
jan 1, 2001
79.465
+1.054
1.34%
jan 1, 2002
120.571
+41.105
51.73%
jan 1, 2003
103.77
-16.8
-13.93%
jan 1, 2004
95.478
-8.293
-7.99%
jan 1, 2005
98.002
+2.525
2.64%
jan 1, 2006
100.665
+2.663
2.72%
jan 1, 2007
102.575
+1.91
1.9%
jan 1, 2008
106.657
+4.083
3.98%
jan 1, 2009
114.387
+7.73
7.25%
jan 1, 2010
120.996
+6.609
5.78%
jan 1, 2011
127.922
+6.926
5.72%
jan 1, 2012
127.498
-0.424
-0.33%
jan 1, 2013
131.452
+3.954
3.1%
jan 1, 2015
134.835
+3.383
2.57%
Ranking of countries by current statistics by years


Comments: