29
/
en
AIzaSyAYiBZKx7MnpbEhh9jyipgxe19OcubqV5w
April 1, 2024
66069
Algeria
DZA
true
2
1
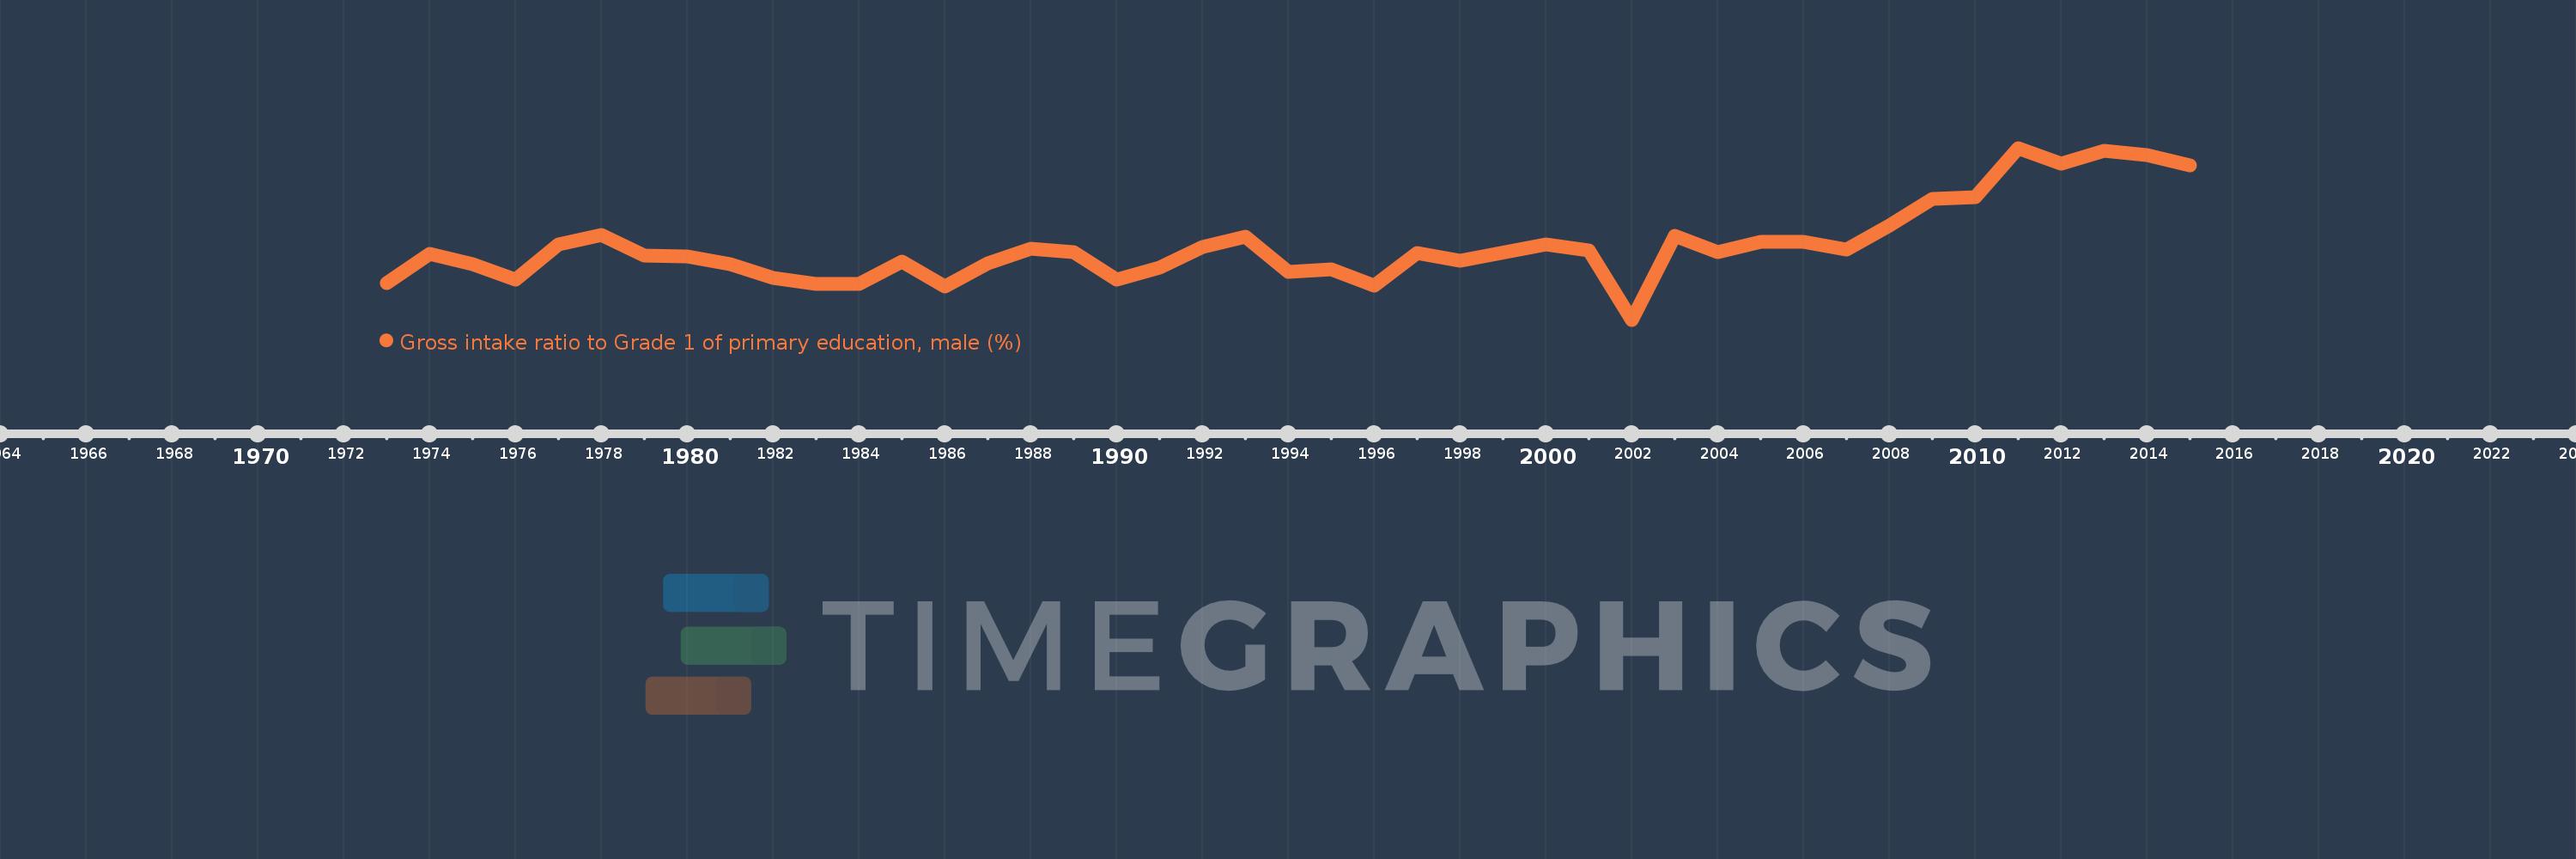
Gross intake ratio to Grade 1 of primary education, male (%)
2015,2014,2013,2012,2011,2010,2009,2008,2007,2006,2005,2004,2003,2002,2001,2000,1998,1997,1996,1995,1994,1993,1992,1991,1990,1989,1988,1987,1986,1985,1984,1983,1982,1981,1980,1979,1978,1977,1976,1975,1974,1973
This statistics in other country:
AfghanistanAlbaniaAlgeriaAngolaAntigua and BarbudaArab WorldArgentinaArmeniaArubaAustriaAzerbaijanBahamas, TheBahrainBangladeshBarbadosBelarusBelgiumBelizeBeninBermudaBhutanBoliviaBosnia and HerzegovinaBotswanaBrazilBrunei DarussalamBulgariaBurkina FasoBurundiCabo VerdeCambodiaCameroonCanadaCaribbean small statesCentral African RepublicCentral Europe and the BalticsChadChileChinaColombiaComorosCongo, Dem. Rep.Congo, Rep.Costa RicaCote d'IvoireCroatiaCubaCyprusCzech RepublicDenmarkDjiboutiDominicaDominican RepublicEarly-demographic dividendEast Asia & PacificEast Asia & Pacific (excluding high income)East Asia & Pacific (IDA & IBRD countries)EcuadorEgypt, Arab Rep.El SalvadorEquatorial GuineaEritreaEstoniaEthiopiaEuro areaEurope & Central AsiaEurope & Central Asia (excluding high income)Europe & Central Asia (IDA & IBRD countries)European UnionFijiFinlandFragile and conflict affected situationsFranceGabonGambia, TheGeorgiaGermanyGhanaGreeceGrenadaGuatemalaGuineaGuinea-BissauGuyanaHaitiHeavily indebted poor countries (HIPC)High incomeHondurasHong Kong SAR, ChinaHungaryIBRD onlyIcelandIDA & IBRD totalIDA blendIDA onlyIDA totalIndiaIndonesiaIran, Islamic Rep.IraqIrelandIsraelItalyJamaicaJapanJordanKazakhstanKenyaKiribatiKorea, Dem. People’s Rep.Korea, Rep.KuwaitKyrgyz RepublicLao PDRLate-demographic dividendLatin America & Caribbean Latin America & Caribbean (excluding high income)Latin America & the Caribbean (IDA & IBRD countries)LatviaLeast developed countries: UN classificationLebanonLesothoLiberiaLibyaLiechtensteinLithuaniaLow & middle incomeLow incomeLower middle incomeLuxembourgMacao SAR, ChinaMacedonia, FYRMadagascarMalawiMaldivesMaliMaltaMarshall IslandsMauritaniaMauritiusMexicoMicronesia, Fed. Sts.Middle East & North AfricaMiddle East & North Africa (excluding high income)Middle East & North Africa (IDA & IBRD countries)Middle incomeMoldovaMongoliaMontenegroMoroccoMozambiqueMyanmarNamibiaNauruNepalNetherlandsNew ZealandNicaraguaNigerNigeriaNorth AmericaNorwayOECD membersOmanOther small statesPacific island small statesPakistanPalauPanamaPapua New GuineaParaguayPeruPhilippinesPolandPortugalPost-demographic dividendPre-demographic dividendPuerto RicoQatarRomaniaRussian FederationRwandaSamoaSan MarinoSao Tome and PrincipeSaudi ArabiaSenegalSerbiaSeychellesSierra LeoneSlovak RepublicSloveniaSmall statesSolomon IslandsSouth AfricaSouth AsiaSouth Asia (IDA & IBRD)South SudanSpainSri LankaSt. Kitts and NevisSt. LuciaSt. Vincent and the GrenadinesSub-Saharan Africa Sub-Saharan Africa (excluding high income)Sub-Saharan Africa (IDA & IBRD countries)SudanSurinameSwazilandSwedenSwitzerlandSyrian Arab RepublicTajikistanTanzaniaThailandTimor-LesteTogoTongaTrinidad and TobagoTunisiaTurkeyTuvaluUgandaUkraineUnited Arab EmiratesUnited StatesUpper middle incomeUruguayUzbekistanVanuatuVenezuela, RBVietnamWest Bank and GazaWorldYemen, Rep.ZambiaZimbabwe Timeline:
This timeline shows a graph from 1973 to 2015 of Algeria. No data until 1972. Number of actual observations by date: 42.
Source name:
World Development Indicators
Source organization:
UNESCO Institute for Statistics
Categories, topics:
Education, Gender
Last updated:
apr 23, 2017
Indicators value changes by year
Maximum:
116.65
jan 1, 2011
At the date of observation
Value
Absolute change
Change from previous value
jan 1, 1973
92.262
+92.262
0.0%
jan 1, 1974
97.474
+5.212
5.65%
jan 1, 1975
95.704
-1.77
-1.82%
jan 1, 1976
92.951
-2.753
-2.88%
jan 1, 1977
99.287
+6.336
6.82%
jan 1, 1978
100.922
+1.635
1.65%
jan 1, 1979
97.181
-3.741
-3.71%
jan 1, 1980
97.002
-0.179
-0.18%
jan 1, 1981
95.681
-1.321
-1.36%
jan 1, 1982
93.13
-2.551
-2.67%
jan 1, 1983
92.14
-0.99
-1.06%
jan 1, 1984
92.085
-0.055
-0.06%
jan 1, 1985
96.208
+4.122
4.48%
jan 1, 1986
91.606
-4.601
-4.78%
jan 1, 1987
95.904
+4.298
4.69%
jan 1, 1988
98.449
+2.545
2.65%
jan 1, 1989
97.78
-0.669
-0.68%
jan 1, 1990
92.921
-4.859
-4.97%
jan 1, 1991
94.981
+2.06
2.22%
jan 1, 1992
98.84
+3.859
4.06%
jan 1, 1993
100.676
+1.836
1.86%
jan 1, 1994
94.214
-6.462
-6.42%
jan 1, 1995
94.681
+0.467
0.5%
jan 1, 1996
91.768
-2.913
-3.08%
jan 1, 1997
97.724
+5.956
6.49%
jan 1, 1998
96.225
-1.498
-1.53%
jan 1, 2000
99.273
+3.048
3.17%
jan 1, 2001
98.198
-1.075
-1.08%
jan 1, 2002
85.64
-12.558
-12.79%
jan 1, 2003
100.72
+15.08
17.61%
jan 1, 2004
97.819
-2.902
-2.88%
jan 1, 2005
99.66
+1.841
1.88%
jan 1, 2006
99.726
+0.066
0.07%
jan 1, 2007
98.231
-1.495
-1.5%
jan 1, 2008
102.6
+4.369
4.45%
jan 1, 2009
107.491
+4.89
4.77%
jan 1, 2010
107.76
+0.269
0.25%
jan 1, 2011
116.65
+8.89
8.25%
jan 1, 2012
113.877
-2.773
-2.38%
jan 1, 2013
116.195
+2.318
2.04%
jan 1, 2014
115.427
-0.768
-0.66%
jan 1, 2015
113.427
-2.0
-1.73%
Ranking of countries by current statistics by years


Comments: