29
/
en
AIzaSyAYiBZKx7MnpbEhh9jyipgxe19OcubqV5w
April 1, 2024
168673
Kiribati
KIR
true
2
1
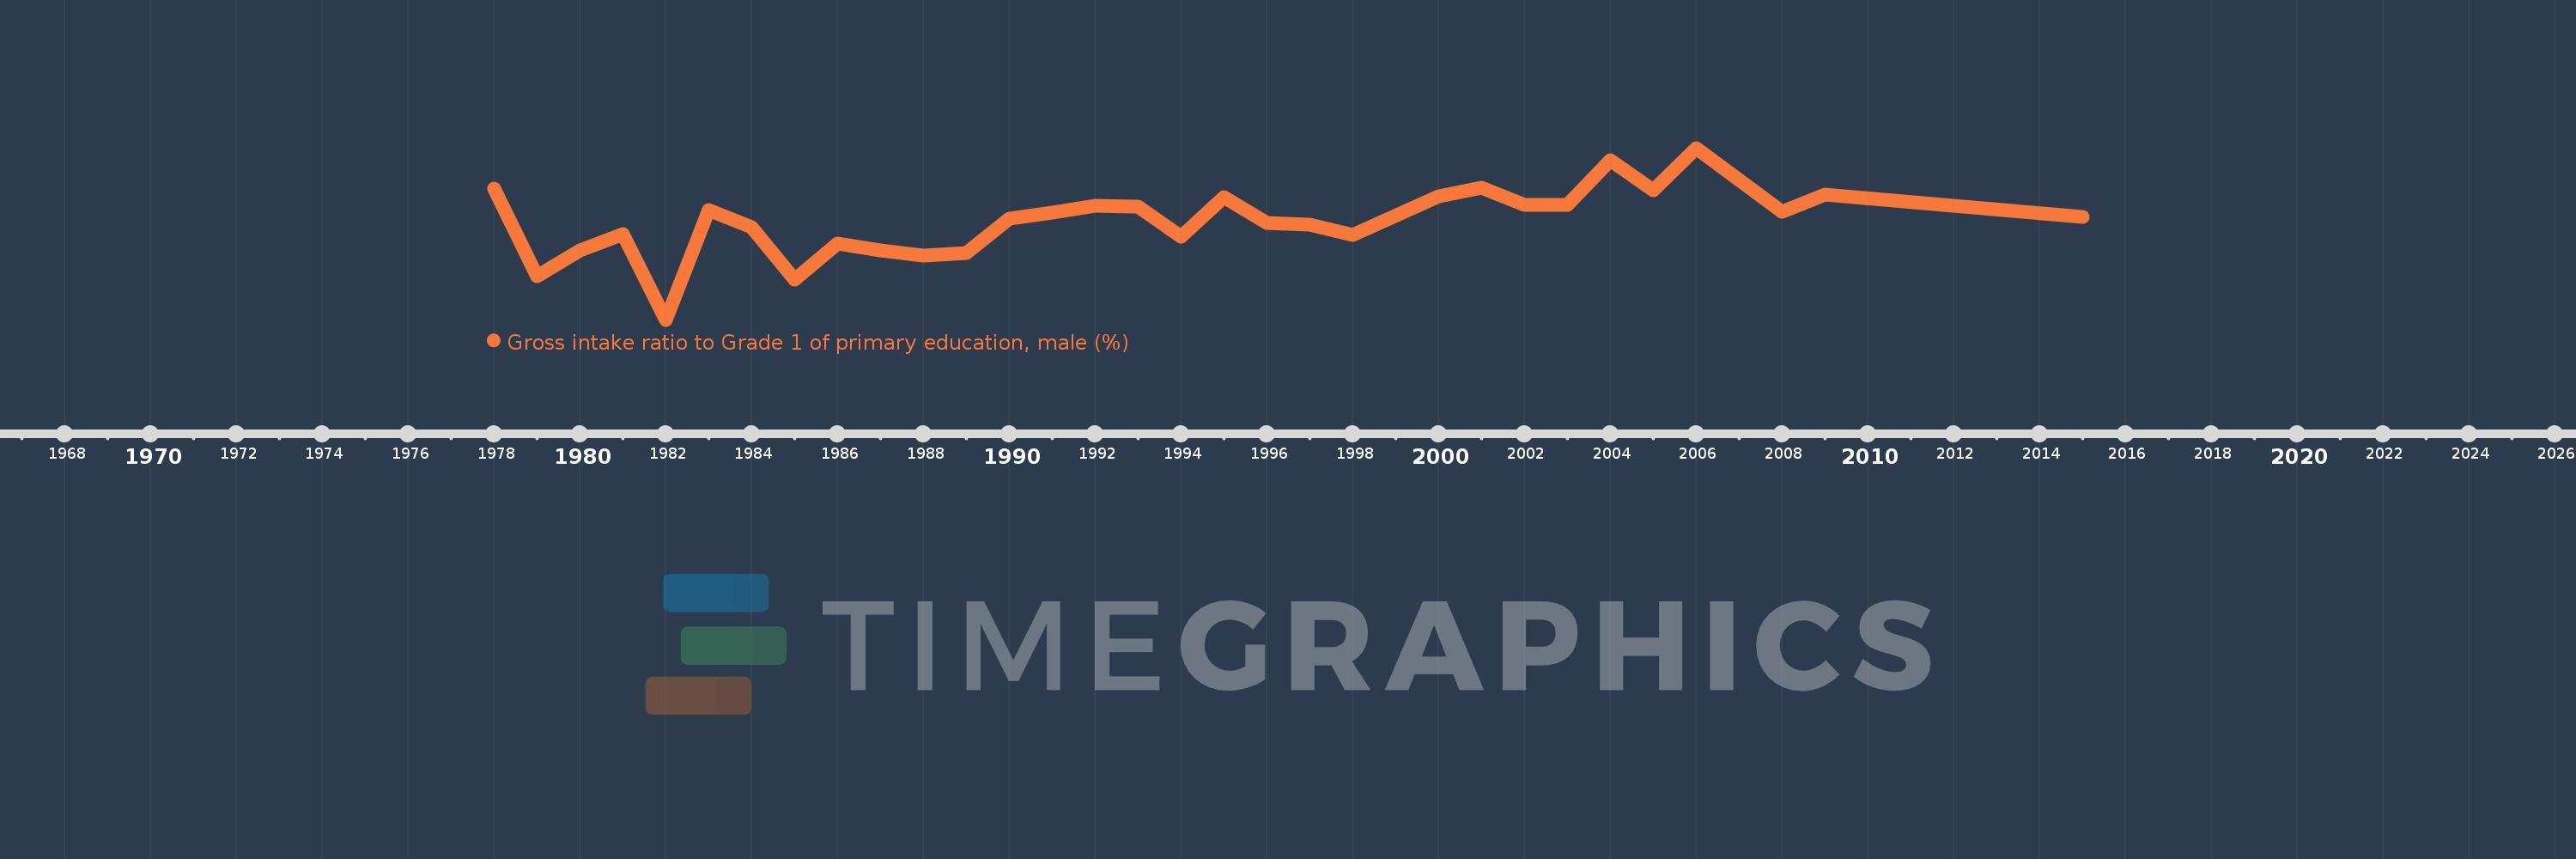
Gross intake ratio to Grade 1 of primary education, male (%)
2015,2009,2008,2007,2006,2005,2004,2003,2002,2001,2000,1998,1997,1996,1995,1994,1993,1992,1991,1990,1989,1988,1987,1986,1985,1984,1983,1982,1981,1980,1979,1978
This statistics in other country:
AfghanistanAlbaniaAlgeriaAngolaAntigua and BarbudaArab WorldArgentinaArmeniaArubaAustriaAzerbaijanBahamas, TheBahrainBangladeshBarbadosBelarusBelgiumBelizeBeninBermudaBhutanBoliviaBosnia and HerzegovinaBotswanaBrazilBrunei DarussalamBulgariaBurkina FasoBurundiCabo VerdeCambodiaCameroonCanadaCaribbean small statesCentral African RepublicCentral Europe and the BalticsChadChileChinaColombiaComorosCongo, Dem. Rep.Congo, Rep.Costa RicaCote d'IvoireCroatiaCubaCyprusCzech RepublicDenmarkDjiboutiDominicaDominican RepublicEarly-demographic dividendEast Asia & PacificEast Asia & Pacific (excluding high income)East Asia & Pacific (IDA & IBRD countries)EcuadorEgypt, Arab Rep.El SalvadorEquatorial GuineaEritreaEstoniaEthiopiaEuro areaEurope & Central AsiaEurope & Central Asia (excluding high income)Europe & Central Asia (IDA & IBRD countries)European UnionFijiFinlandFragile and conflict affected situationsFranceGabonGambia, TheGeorgiaGermanyGhanaGreeceGrenadaGuatemalaGuineaGuinea-BissauGuyanaHaitiHeavily indebted poor countries (HIPC)High incomeHondurasHong Kong SAR, ChinaHungaryIBRD onlyIcelandIDA & IBRD totalIDA blendIDA onlyIDA totalIndiaIndonesiaIran, Islamic Rep.IraqIrelandIsraelItalyJamaicaJapanJordanKazakhstanKenyaKiribatiKorea, Dem. People’s Rep.Korea, Rep.KuwaitKyrgyz RepublicLao PDRLate-demographic dividendLatin America & Caribbean Latin America & Caribbean (excluding high income)Latin America & the Caribbean (IDA & IBRD countries)LatviaLeast developed countries: UN classificationLebanonLesothoLiberiaLibyaLiechtensteinLithuaniaLow & middle incomeLow incomeLower middle incomeLuxembourgMacao SAR, ChinaMacedonia, FYRMadagascarMalawiMaldivesMaliMaltaMarshall IslandsMauritaniaMauritiusMexicoMicronesia, Fed. Sts.Middle East & North AfricaMiddle East & North Africa (excluding high income)Middle East & North Africa (IDA & IBRD countries)Middle incomeMoldovaMongoliaMontenegroMoroccoMozambiqueMyanmarNamibiaNauruNepalNetherlandsNew ZealandNicaraguaNigerNigeriaNorth AmericaNorwayOECD membersOmanOther small statesPacific island small statesPakistanPalauPanamaPapua New GuineaParaguayPeruPhilippinesPolandPortugalPost-demographic dividendPre-demographic dividendPuerto RicoQatarRomaniaRussian FederationRwandaSamoaSan MarinoSao Tome and PrincipeSaudi ArabiaSenegalSerbiaSeychellesSierra LeoneSlovak RepublicSloveniaSmall statesSolomon IslandsSouth AfricaSouth AsiaSouth Asia (IDA & IBRD)South SudanSpainSri LankaSt. Kitts and NevisSt. LuciaSt. Vincent and the GrenadinesSub-Saharan Africa Sub-Saharan Africa (excluding high income)Sub-Saharan Africa (IDA & IBRD countries)SudanSurinameSwazilandSwedenSwitzerlandSyrian Arab RepublicTajikistanTanzaniaThailandTimor-LesteTogoTongaTrinidad and TobagoTunisiaTurkeyTuvaluUgandaUkraineUnited Arab EmiratesUnited StatesUpper middle incomeUruguayUzbekistanVanuatuVenezuela, RBVietnamWest Bank and GazaWorldYemen, Rep.ZambiaZimbabwe Timeline:
This timeline shows a graph from 1978 to 2015 of Kiribati. No data until 1977. Number of actual observations by date: 32.
Source name:
World Development Indicators
Source organization:
UNESCO Institute for Statistics
Categories, topics:
Education, Gender
Last updated:
apr 23, 2017
Indicators value changes by year
Maximum:
124.981
jan 1, 2006
At the date of observation
Value
Absolute change
Change from previous value
jan 1, 1978
115.832
+115.832
0.0%
jan 1, 1979
95.736
-20.096
-17.35%
jan 1, 1980
101.669
+5.933
6.2%
jan 1, 1981
105.432
+3.763
3.7%
jan 1, 1982
85.91
-19.522
-18.52%
jan 1, 1983
110.892
+24.983
29.08%
jan 1, 1984
106.983
-3.91
-3.53%
jan 1, 1985
95.03
-11.953
-11.17%
jan 1, 1986
103.178
+8.149
8.57%
jan 1, 1987
101.751
-1.428
-1.38%
jan 1, 1988
100.532
-1.219
-1.2%
jan 1, 1989
101.143
+0.612
0.61%
jan 1, 1990
108.952
+7.809
7.72%
jan 1, 1991
110.348
+1.396
1.28%
jan 1, 1992
111.912
+1.563
1.42%
jan 1, 1993
111.596
-0.316
-0.28%
jan 1, 1994
104.766
-6.829
-6.12%
jan 1, 1995
113.736
+8.97
8.56%
jan 1, 1996
107.831
-5.904
-5.19%
jan 1, 1997
107.502
-0.329
-0.31%
jan 1, 1998
105.174
-2.328
-2.17%
jan 1, 2000
113.887
+8.713
8.28%
jan 1, 2001
115.936
+2.049
1.8%
jan 1, 2002
111.973
-3.963
-3.42%
jan 1, 2003
112.003
+0.03
0.03%
jan 1, 2004
122.15
+10.147
9.06%
jan 1, 2005
115.3
-6.851
-5.61%
jan 1, 2006
124.981
+9.681
8.4%
jan 1, 2007
117.712
-7.269
-5.82%
jan 1, 2008
110.496
-7.215
-6.13%
jan 1, 2009
114.457
+3.96
3.58%
jan 1, 2015
109.241
-5.216
-4.56%
Ranking of countries by current statistics by years


Comments: