29
/
en
AIzaSyAYiBZKx7MnpbEhh9jyipgxe19OcubqV5w
April 1, 2024
57099
South Asia
SAS
false
2
1
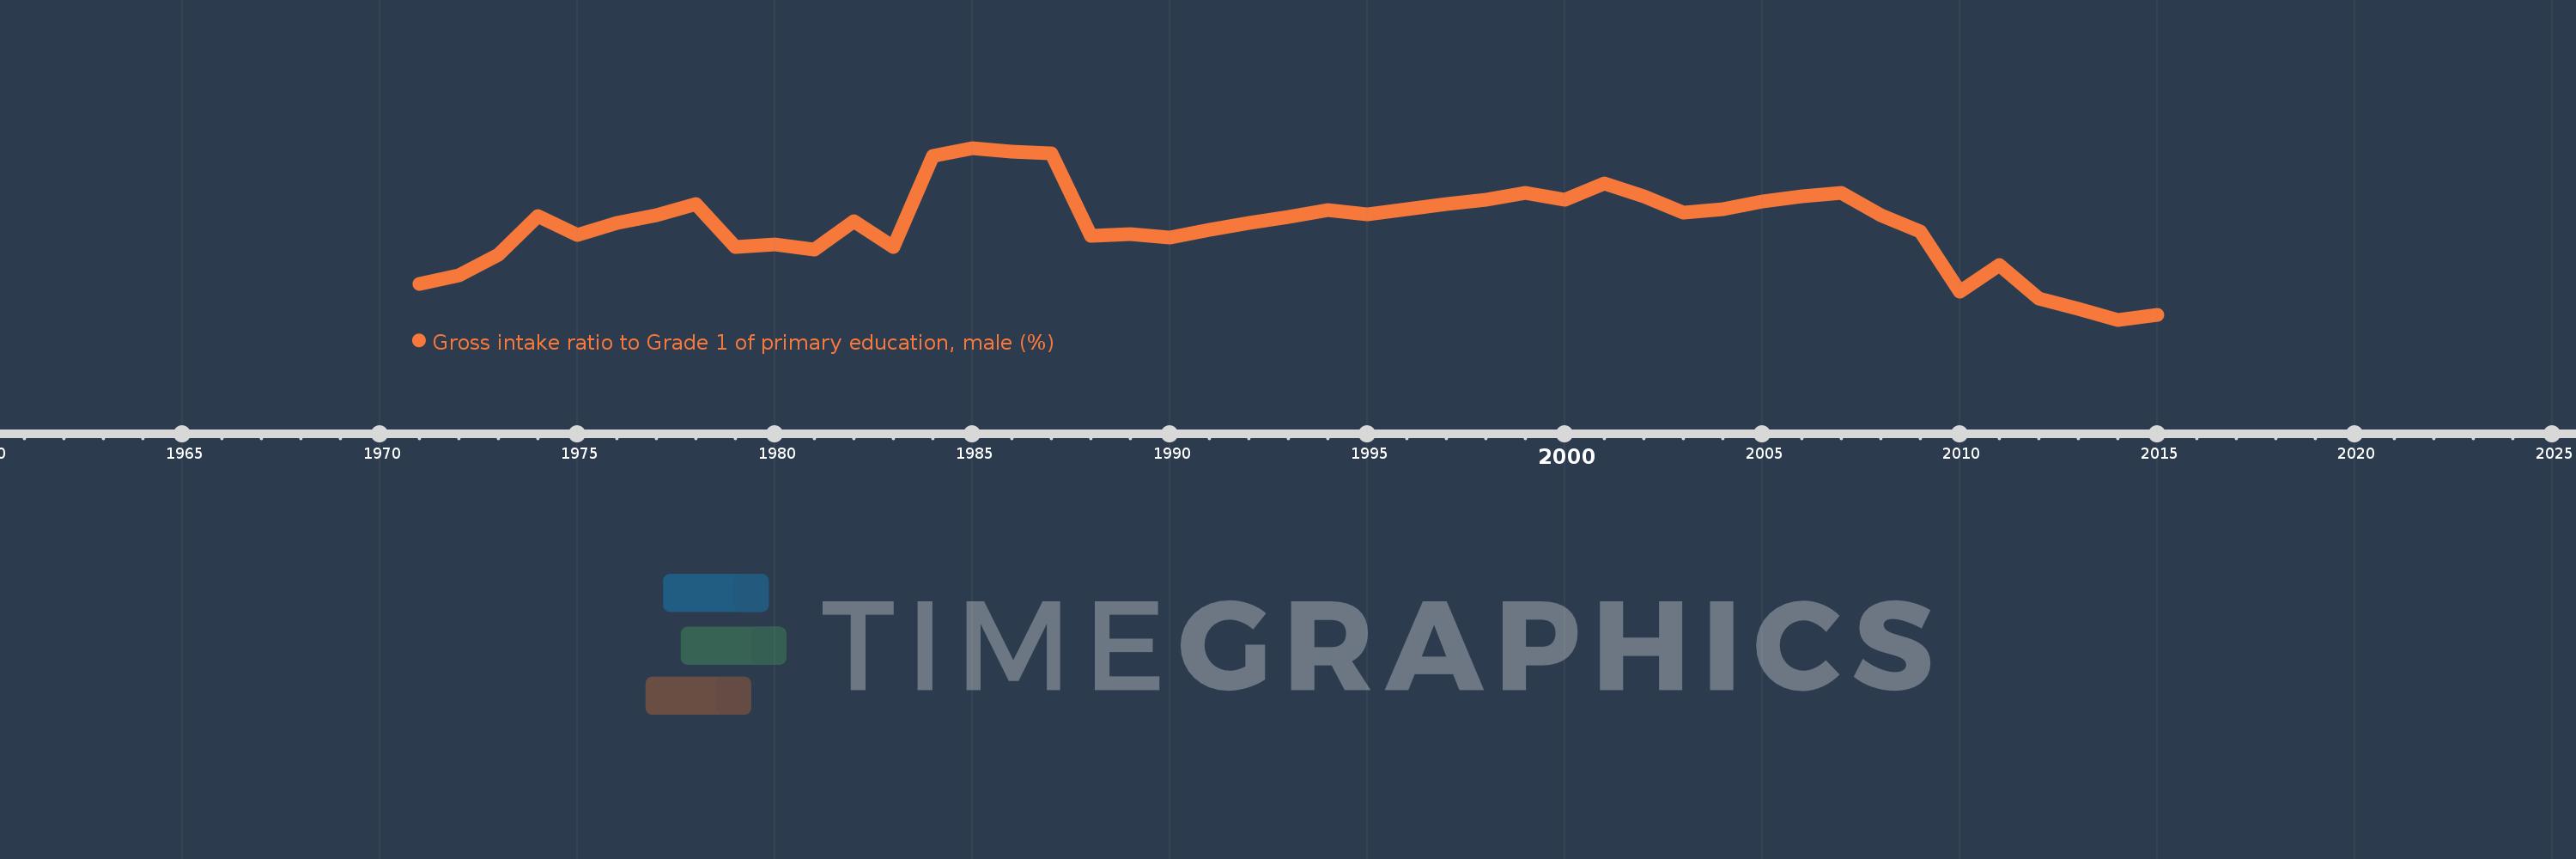
Gross intake ratio to Grade 1 of primary education, male (%)
2015,2014,2013,2012,2011,2010,2009,2008,2007,2006,2005,2004,2003,2002,2001,2000,1999,1998,1997,1996,1995,1994,1993,1992,1991,1990,1989,1988,1987,1986,1985,1984,1983,1982,1981,1980,1979,1978,1977,1976,1975,1974,1973,1972,1971
This statistics in other country:
AfghanistanAlbaniaAlgeriaAngolaAntigua and BarbudaArab WorldArgentinaArmeniaArubaAustriaAzerbaijanBahamas, TheBahrainBangladeshBarbadosBelarusBelgiumBelizeBeninBermudaBhutanBoliviaBosnia and HerzegovinaBotswanaBrazilBrunei DarussalamBulgariaBurkina FasoBurundiCabo VerdeCambodiaCameroonCanadaCaribbean small statesCentral African RepublicCentral Europe and the BalticsChadChileChinaColombiaComorosCongo, Dem. Rep.Congo, Rep.Costa RicaCote d'IvoireCroatiaCubaCyprusCzech RepublicDenmarkDjiboutiDominicaDominican RepublicEarly-demographic dividendEast Asia & PacificEast Asia & Pacific (excluding high income)East Asia & Pacific (IDA & IBRD countries)EcuadorEgypt, Arab Rep.El SalvadorEquatorial GuineaEritreaEstoniaEthiopiaEuro areaEurope & Central AsiaEurope & Central Asia (excluding high income)Europe & Central Asia (IDA & IBRD countries)European UnionFijiFinlandFragile and conflict affected situationsFranceGabonGambia, TheGeorgiaGermanyGhanaGreeceGrenadaGuatemalaGuineaGuinea-BissauGuyanaHaitiHeavily indebted poor countries (HIPC)High incomeHondurasHong Kong SAR, ChinaHungaryIBRD onlyIcelandIDA & IBRD totalIDA blendIDA onlyIDA totalIndiaIndonesiaIran, Islamic Rep.IraqIrelandIsraelItalyJamaicaJapanJordanKazakhstanKenyaKiribatiKorea, Dem. People’s Rep.Korea, Rep.KuwaitKyrgyz RepublicLao PDRLate-demographic dividendLatin America & Caribbean Latin America & Caribbean (excluding high income)Latin America & the Caribbean (IDA & IBRD countries)LatviaLeast developed countries: UN classificationLebanonLesothoLiberiaLibyaLiechtensteinLithuaniaLow & middle incomeLow incomeLower middle incomeLuxembourgMacao SAR, ChinaMacedonia, FYRMadagascarMalawiMaldivesMaliMaltaMarshall IslandsMauritaniaMauritiusMexicoMicronesia, Fed. Sts.Middle East & North AfricaMiddle East & North Africa (excluding high income)Middle East & North Africa (IDA & IBRD countries)Middle incomeMoldovaMongoliaMontenegroMoroccoMozambiqueMyanmarNamibiaNauruNepalNetherlandsNew ZealandNicaraguaNigerNigeriaNorth AmericaNorwayOECD membersOmanOther small statesPacific island small statesPakistanPalauPanamaPapua New GuineaParaguayPeruPhilippinesPolandPortugalPost-demographic dividendPre-demographic dividendPuerto RicoQatarRomaniaRussian FederationRwandaSamoaSan MarinoSao Tome and PrincipeSaudi ArabiaSenegalSerbiaSeychellesSierra LeoneSlovak RepublicSloveniaSmall statesSolomon IslandsSouth AfricaSouth AsiaSouth Asia (IDA & IBRD)South SudanSpainSri LankaSt. Kitts and NevisSt. LuciaSt. Vincent and the GrenadinesSub-Saharan Africa Sub-Saharan Africa (excluding high income)Sub-Saharan Africa (IDA & IBRD countries)SudanSurinameSwazilandSwedenSwitzerlandSyrian Arab RepublicTajikistanTanzaniaThailandTimor-LesteTogoTongaTrinidad and TobagoTunisiaTurkeyTuvaluUgandaUkraineUnited Arab EmiratesUnited StatesUpper middle incomeUruguayUzbekistanVanuatuVenezuela, RBVietnamWest Bank and GazaWorldYemen, Rep.ZambiaZimbabwe Timeline:
This timeline shows a graph from 1971 to 2015 of South Asia. No data until 1970. Number of actual observations by date: 45.
Source name:
World Development Indicators
Source organization:
UNESCO Institute for Statistics
Categories, topics:
Education, Gender
Last updated:
apr 23, 2017
Indicators value changes by year
Minimum:
108.466
jan 1, 2014
Maximum:
135.79
jan 1, 1985
At the date of observation
Value
Absolute change
Change from previous value
jan 1, 1971
114.179
+114.179
0.0%
jan 1, 1972
115.539
+1.36
1.19%
jan 1, 1973
118.746
+3.207
2.78%
jan 1, 1974
124.896
+6.15
5.18%
jan 1, 1975
122.009
-2.887
-2.31%
jan 1, 1976
123.93
+1.921
1.57%
jan 1, 1977
125.104
+1.175
0.95%
jan 1, 1978
126.905
+1.801
1.44%
jan 1, 1979
120.049
-6.856
-5.4%
jan 1, 1980
120.463
+0.414
0.35%
jan 1, 1981
119.687
-0.777
-0.64%
jan 1, 1982
124.115
+4.429
3.7%
jan 1, 1983
120.055
-4.06
-3.27%
jan 1, 1984
134.539
+14.484
12.06%
jan 1, 1985
135.79
+1.25
0.93%
jan 1, 1986
135.221
-0.569
-0.42%
jan 1, 1987
134.99
-0.23
-0.17%
jan 1, 1988
121.875
-13.116
-9.72%
jan 1, 1989
122.095
+0.22
0.18%
jan 1, 1990
121.563
-0.532
-0.44%
jan 1, 1991
122.819
+1.256
1.03%
jan 1, 1992
123.887
+1.068
0.87%
jan 1, 1993
124.807
+0.92
0.74%
jan 1, 1994
125.952
+1.145
0.92%
jan 1, 1995
125.291
-0.661
-0.52%
jan 1, 1996
126.108
+0.818
0.65%
jan 1, 1997
126.853
+0.745
0.59%
jan 1, 1998
127.507
+0.654
0.52%
jan 1, 1999
128.692
+1.185
0.93%
jan 1, 2000
127.586
-1.106
-0.86%
jan 1, 2001
130.212
+2.627
2.06%
jan 1, 2002
128.097
-2.116
-1.62%
jan 1, 2003
125.442
-2.655
-2.07%
jan 1, 2004
126.114
+0.672
0.54%
jan 1, 2005
127.214
+1.1
0.87%
jan 1, 2006
128.133
+0.919
0.72%
jan 1, 2007
128.693
+0.56
0.44%
jan 1, 2008
125.114
-3.579
-2.78%
jan 1, 2009
122.561
-2.553
-2.04%
jan 1, 2010
112.882
-9.679
-7.9%
jan 1, 2011
117.237
+4.354
3.86%
jan 1, 2012
111.774
-5.462
-4.66%
jan 1, 2013
110.253
-1.521
-1.36%
jan 1, 2014
108.466
-1.787
-1.62%
jan 1, 2015
109.275
+0.808
0.75%
Ranking of countries by current statistics by years


Comments: