29
/
en
AIzaSyAYiBZKx7MnpbEhh9jyipgxe19OcubqV5w
April 1, 2024
92646
Brunei Darussalam
BRN
true
2
1
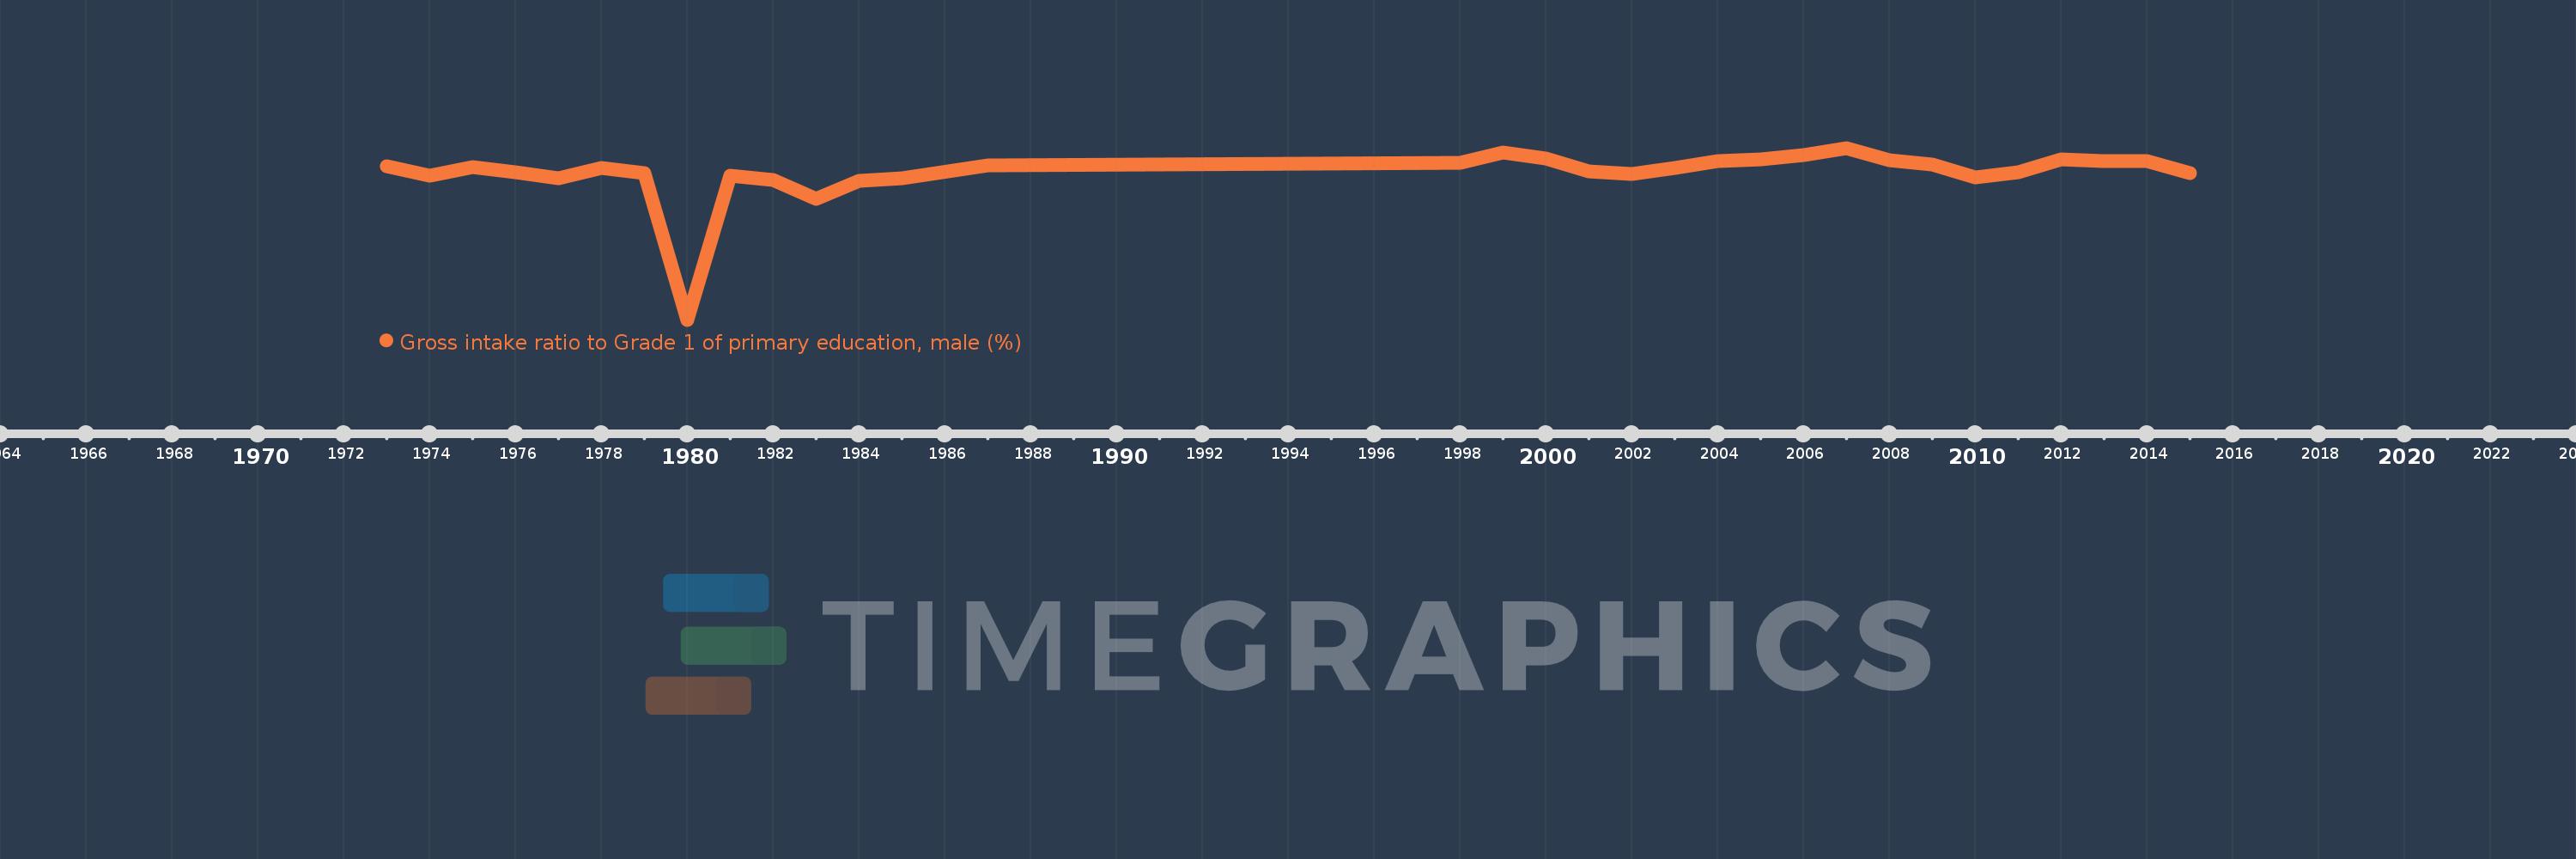
Gross intake ratio to Grade 1 of primary education, male (%)
2015,2014,2013,2012,2011,2010,2009,2008,2007,2006,2005,2004,2003,2002,2001,2000,1999,1998,1987,1985,1984,1983,1982,1981,1980,1979,1978,1977,1976,1975,1974,1973
This statistics in other country:
AfghanistanAlbaniaAlgeriaAngolaAntigua and BarbudaArab WorldArgentinaArmeniaArubaAustriaAzerbaijanBahamas, TheBahrainBangladeshBarbadosBelarusBelgiumBelizeBeninBermudaBhutanBoliviaBosnia and HerzegovinaBotswanaBrazilBrunei DarussalamBulgariaBurkina FasoBurundiCabo VerdeCambodiaCameroonCanadaCaribbean small statesCentral African RepublicCentral Europe and the BalticsChadChileChinaColombiaComorosCongo, Dem. Rep.Congo, Rep.Costa RicaCote d'IvoireCroatiaCubaCyprusCzech RepublicDenmarkDjiboutiDominicaDominican RepublicEarly-demographic dividendEast Asia & PacificEast Asia & Pacific (excluding high income)East Asia & Pacific (IDA & IBRD countries)EcuadorEgypt, Arab Rep.El SalvadorEquatorial GuineaEritreaEstoniaEthiopiaEuro areaEurope & Central AsiaEurope & Central Asia (excluding high income)Europe & Central Asia (IDA & IBRD countries)European UnionFijiFinlandFragile and conflict affected situationsFranceGabonGambia, TheGeorgiaGermanyGhanaGreeceGrenadaGuatemalaGuineaGuinea-BissauGuyanaHaitiHeavily indebted poor countries (HIPC)High incomeHondurasHong Kong SAR, ChinaHungaryIBRD onlyIcelandIDA & IBRD totalIDA blendIDA onlyIDA totalIndiaIndonesiaIran, Islamic Rep.IraqIrelandIsraelItalyJamaicaJapanJordanKazakhstanKenyaKiribatiKorea, Dem. People’s Rep.Korea, Rep.KuwaitKyrgyz RepublicLao PDRLate-demographic dividendLatin America & Caribbean Latin America & Caribbean (excluding high income)Latin America & the Caribbean (IDA & IBRD countries)LatviaLeast developed countries: UN classificationLebanonLesothoLiberiaLibyaLiechtensteinLithuaniaLow & middle incomeLow incomeLower middle incomeLuxembourgMacao SAR, ChinaMacedonia, FYRMadagascarMalawiMaldivesMaliMaltaMarshall IslandsMauritaniaMauritiusMexicoMicronesia, Fed. Sts.Middle East & North AfricaMiddle East & North Africa (excluding high income)Middle East & North Africa (IDA & IBRD countries)Middle incomeMoldovaMongoliaMontenegroMoroccoMozambiqueMyanmarNamibiaNauruNepalNetherlandsNew ZealandNicaraguaNigerNigeriaNorth AmericaNorwayOECD membersOmanOther small statesPacific island small statesPakistanPalauPanamaPapua New GuineaParaguayPeruPhilippinesPolandPortugalPost-demographic dividendPre-demographic dividendPuerto RicoQatarRomaniaRussian FederationRwandaSamoaSan MarinoSao Tome and PrincipeSaudi ArabiaSenegalSerbiaSeychellesSierra LeoneSlovak RepublicSloveniaSmall statesSolomon IslandsSouth AfricaSouth AsiaSouth Asia (IDA & IBRD)South SudanSpainSri LankaSt. Kitts and NevisSt. LuciaSt. Vincent and the GrenadinesSub-Saharan Africa Sub-Saharan Africa (excluding high income)Sub-Saharan Africa (IDA & IBRD countries)SudanSurinameSwazilandSwedenSwitzerlandSyrian Arab RepublicTajikistanTanzaniaThailandTimor-LesteTogoTongaTrinidad and TobagoTunisiaTurkeyTuvaluUgandaUkraineUnited Arab EmiratesUnited StatesUpper middle incomeUruguayUzbekistanVanuatuVenezuela, RBVietnamWest Bank and GazaWorldYemen, Rep.ZambiaZimbabwe Timeline:
This timeline shows a graph from 1973 to 2015 of Brunei Darussalam. No data until 1972. Number of actual observations by date: 32.
Source name:
World Development Indicators
Source organization:
UNESCO Institute for Statistics
Categories, topics:
Education, Gender
Last updated:
apr 23, 2017
Indicators value changes by year
Minimum:
33.809
jan 1, 1980
Maximum:
115.923
jan 1, 2007
At the date of observation
Value
Absolute change
Change from previous value
jan 1, 1973
107.357
+107.357
0.0%
jan 1, 1974
102.67
-4.687
-4.37%
jan 1, 1975
106.751
+4.081
3.97%
jan 1, 1976
104.479
-2.272
-2.13%
jan 1, 1977
101.286
-3.193
-3.06%
jan 1, 1978
106.325
+5.039
4.97%
jan 1, 1979
103.987
-2.338
-2.2%
jan 1, 1980
33.809
-70.178
-67.49%
jan 1, 1981
102.459
+68.65
203.05%
jan 1, 1982
100.518
-1.941
-1.89%
jan 1, 1983
91.595
-8.923
-8.88%
jan 1, 1984
100.208
+8.613
9.4%
jan 1, 1985
101.558
+1.349
1.35%
jan 1, 1987
107.71
+6.152
6.06%
jan 1, 1998
108.965
+1.255
1.17%
jan 1, 1999
113.727
+4.761
4.37%
jan 1, 2000
111.028
-2.698
-2.37%
jan 1, 2001
104.648
-6.38
-5.75%
jan 1, 2002
103.291
-1.356
-1.3%
jan 1, 2003
106.39
+3.099
3.0%
jan 1, 2004
109.611
+3.221
3.03%
jan 1, 2005
110.414
+0.803
0.73%
jan 1, 2006
112.457
+2.043
1.85%
jan 1, 2007
115.923
+3.466
3.08%
jan 1, 2008
110.017
-5.906
-5.09%
jan 1, 2009
107.883
-2.135
-1.94%
jan 1, 2010
101.976
-5.907
-5.48%
jan 1, 2011
104.425
+2.449
2.4%
jan 1, 2012
110.382
+5.957
5.7%
jan 1, 2013
109.738
-0.644
-0.58%
jan 1, 2014
109.776
+0.038
0.03%
jan 1, 2015
103.978
-5.798
-5.28%
Ranking of countries by current statistics by years


Comments: