29
/
en
AIzaSyAYiBZKx7MnpbEhh9jyipgxe19OcubqV5w
April 1, 2024
193090
Mauritania
MRT
true
2
1
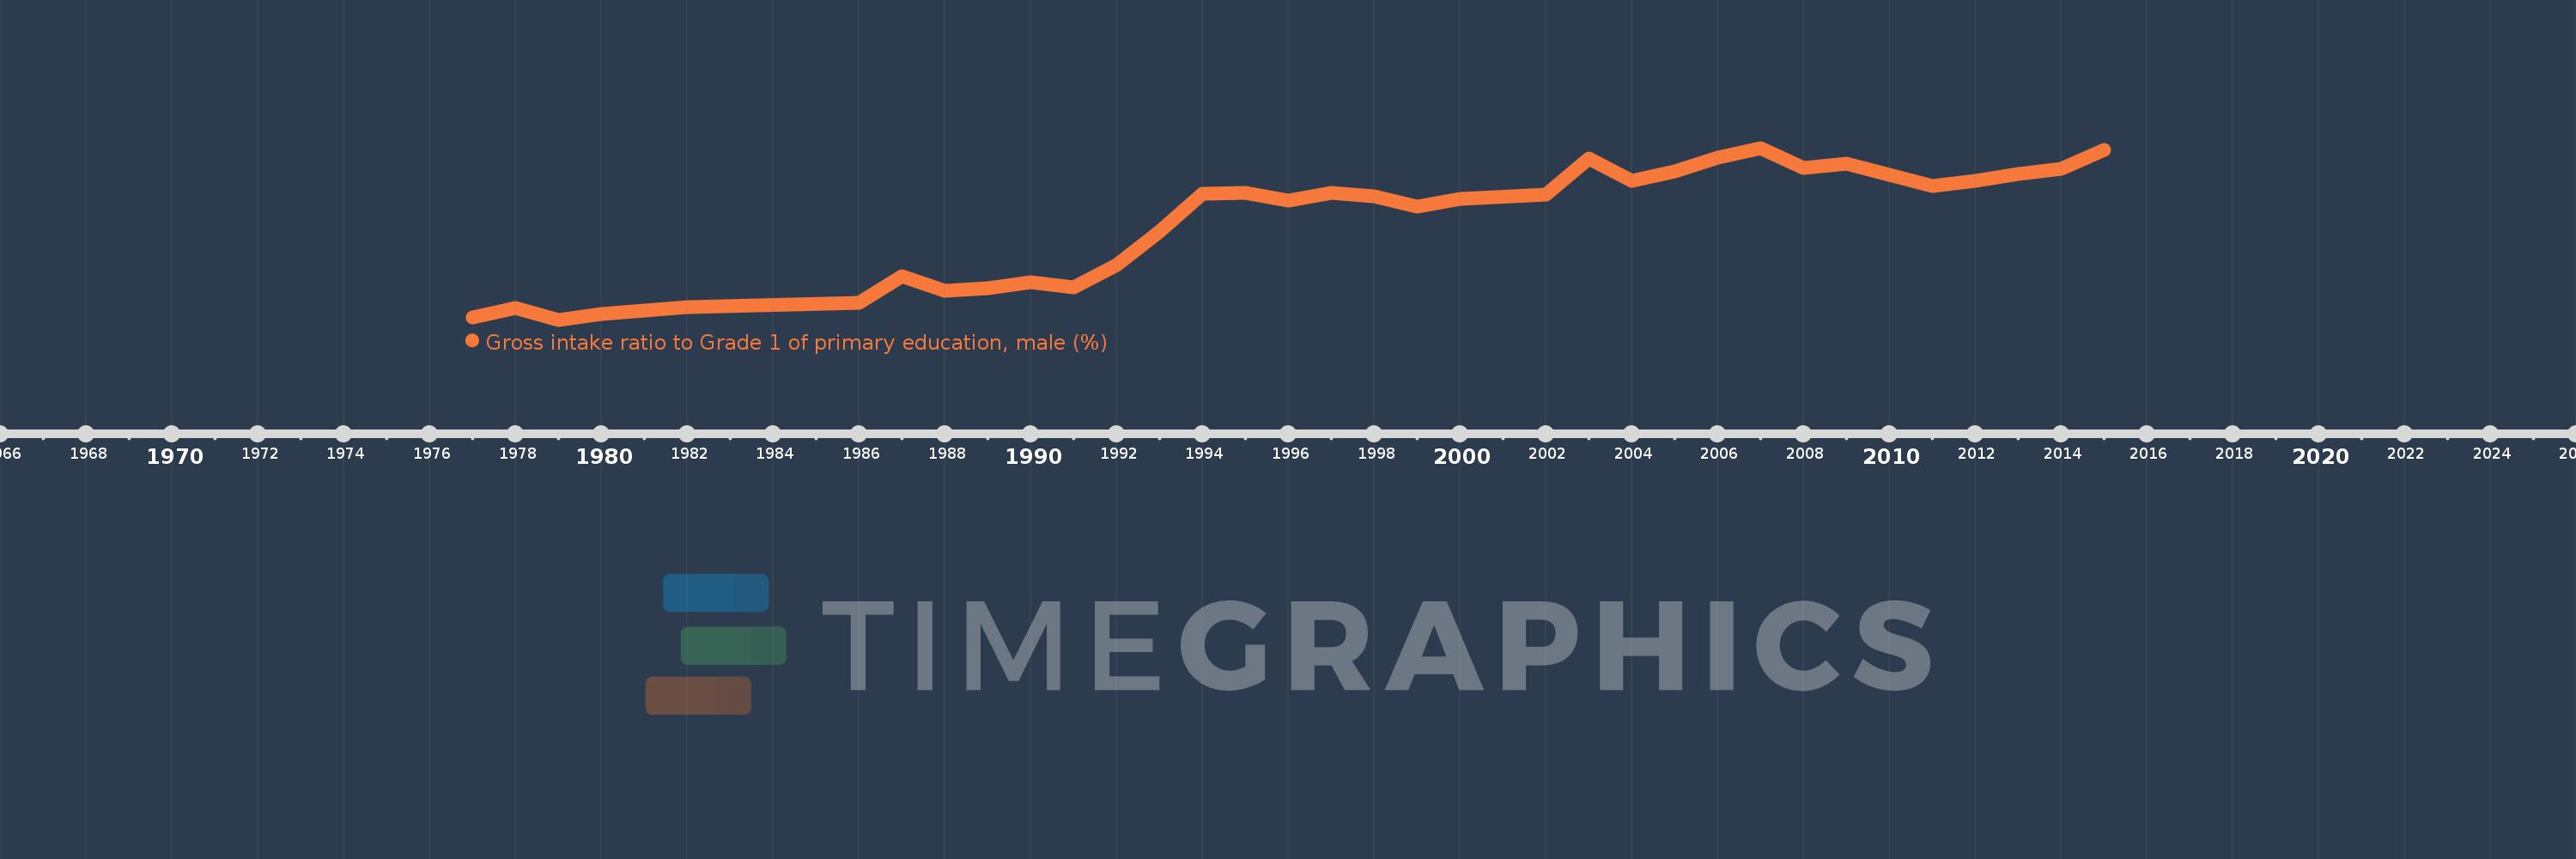
Gross intake ratio to Grade 1 of primary education, male (%)
2015,2014,2013,2012,2011,2010,2009,2008,2007,2006,2005,2004,2003,2002,2000,1999,1998,1997,1996,1995,1994,1993,1992,1991,1990,1989,1988,1987,1986,1982,1980,1979,1978,1977
This statistics in other country:
AfghanistanAlbaniaAlgeriaAngolaAntigua and BarbudaArab WorldArgentinaArmeniaArubaAustriaAzerbaijanBahamas, TheBahrainBangladeshBarbadosBelarusBelgiumBelizeBeninBermudaBhutanBoliviaBosnia and HerzegovinaBotswanaBrazilBrunei DarussalamBulgariaBurkina FasoBurundiCabo VerdeCambodiaCameroonCanadaCaribbean small statesCentral African RepublicCentral Europe and the BalticsChadChileChinaColombiaComorosCongo, Dem. Rep.Congo, Rep.Costa RicaCote d'IvoireCroatiaCubaCyprusCzech RepublicDenmarkDjiboutiDominicaDominican RepublicEarly-demographic dividendEast Asia & PacificEast Asia & Pacific (excluding high income)East Asia & Pacific (IDA & IBRD countries)EcuadorEgypt, Arab Rep.El SalvadorEquatorial GuineaEritreaEstoniaEthiopiaEuro areaEurope & Central AsiaEurope & Central Asia (excluding high income)Europe & Central Asia (IDA & IBRD countries)European UnionFijiFinlandFragile and conflict affected situationsFranceGabonGambia, TheGeorgiaGermanyGhanaGreeceGrenadaGuatemalaGuineaGuinea-BissauGuyanaHaitiHeavily indebted poor countries (HIPC)High incomeHondurasHong Kong SAR, ChinaHungaryIBRD onlyIcelandIDA & IBRD totalIDA blendIDA onlyIDA totalIndiaIndonesiaIran, Islamic Rep.IraqIrelandIsraelItalyJamaicaJapanJordanKazakhstanKenyaKiribatiKorea, Dem. People’s Rep.Korea, Rep.KuwaitKyrgyz RepublicLao PDRLate-demographic dividendLatin America & Caribbean Latin America & Caribbean (excluding high income)Latin America & the Caribbean (IDA & IBRD countries)LatviaLeast developed countries: UN classificationLebanonLesothoLiberiaLibyaLiechtensteinLithuaniaLow & middle incomeLow incomeLower middle incomeLuxembourgMacao SAR, ChinaMacedonia, FYRMadagascarMalawiMaldivesMaliMaltaMarshall IslandsMauritaniaMauritiusMexicoMicronesia, Fed. Sts.Middle East & North AfricaMiddle East & North Africa (excluding high income)Middle East & North Africa (IDA & IBRD countries)Middle incomeMoldovaMongoliaMontenegroMoroccoMozambiqueMyanmarNamibiaNauruNepalNetherlandsNew ZealandNicaraguaNigerNigeriaNorth AmericaNorwayOECD membersOmanOther small statesPacific island small statesPakistanPalauPanamaPapua New GuineaParaguayPeruPhilippinesPolandPortugalPost-demographic dividendPre-demographic dividendPuerto RicoQatarRomaniaRussian FederationRwandaSamoaSan MarinoSao Tome and PrincipeSaudi ArabiaSenegalSerbiaSeychellesSierra LeoneSlovak RepublicSloveniaSmall statesSolomon IslandsSouth AfricaSouth AsiaSouth Asia (IDA & IBRD)South SudanSpainSri LankaSt. Kitts and NevisSt. LuciaSt. Vincent and the GrenadinesSub-Saharan Africa Sub-Saharan Africa (excluding high income)Sub-Saharan Africa (IDA & IBRD countries)SudanSurinameSwazilandSwedenSwitzerlandSyrian Arab RepublicTajikistanTanzaniaThailandTimor-LesteTogoTongaTrinidad and TobagoTunisiaTurkeyTuvaluUgandaUkraineUnited Arab EmiratesUnited StatesUpper middle incomeUruguayUzbekistanVanuatuVenezuela, RBVietnamWest Bank and GazaWorldYemen, Rep.ZambiaZimbabwe Timeline:
This timeline shows a graph from 1977 to 2015 of Mauritania. No data until 1976. Number of actual observations by date: 34.
Source name:
World Development Indicators
Source organization:
UNESCO Institute for Statistics
Categories, topics:
Education, Gender
Last updated:
apr 23, 2017
Indicators value changes by year
Minimum:
37.118
jan 1, 1979
Maximum:
114.507
jan 1, 2007
At the date of observation
Value
Absolute change
Change from previous value
jan 1, 1977
38.086
+38.086
0.0%
jan 1, 1978
42.477
+4.391
11.53%
jan 1, 1979
37.118
-5.359
-12.62%
jan 1, 1980
39.879
+2.762
7.44%
jan 1, 1982
42.965
+3.086
7.74%
jan 1, 1986
44.926
+1.961
4.56%
jan 1, 1987
56.779
+11.853
26.38%
jan 1, 1988
50.0
-6.779
-11.94%
jan 1, 1989
51.439
+1.439
2.88%
jan 1, 1990
54.133
+2.694
5.24%
jan 1, 1991
51.583
-2.55
-4.71%
jan 1, 1992
61.632
+10.049
19.48%
jan 1, 1993
76.719
+15.086
24.48%
jan 1, 1994
93.848
+17.129
22.33%
jan 1, 1995
94.418
+0.57
0.61%
jan 1, 1996
90.947
-3.471
-3.68%
jan 1, 1997
94.237
+3.291
3.62%
jan 1, 1998
92.568
-1.67
-1.77%
jan 1, 1999
87.922
-4.646
-5.02%
jan 1, 2000
91.592
+3.67
4.17%
jan 1, 2002
93.478
+1.886
2.06%
jan 1, 2003
109.888
+16.41
17.56%
jan 1, 2004
99.504
-10.384
-9.45%
jan 1, 2005
103.86
+4.356
4.38%
jan 1, 2006
110.137
+6.277
6.04%
jan 1, 2007
114.507
+4.37
3.97%
jan 1, 2008
105.589
-8.918
-7.79%
jan 1, 2009
107.528
+1.94
1.84%
jan 1, 2010
102.335
-5.194
-4.83%
jan 1, 2011
97.496
-4.839
-4.73%
jan 1, 2012
99.62
+2.124
2.18%
jan 1, 2013
102.636
+3.016
3.03%
jan 1, 2014
105.147
+2.511
2.45%
jan 1, 2015
113.736
+8.589
8.17%
Ranking of countries by current statistics by years


Comments: