29
/
en
AIzaSyAYiBZKx7MnpbEhh9jyipgxe19OcubqV5w
April 1, 2024
39959
IDA total
IDA
false
2
1
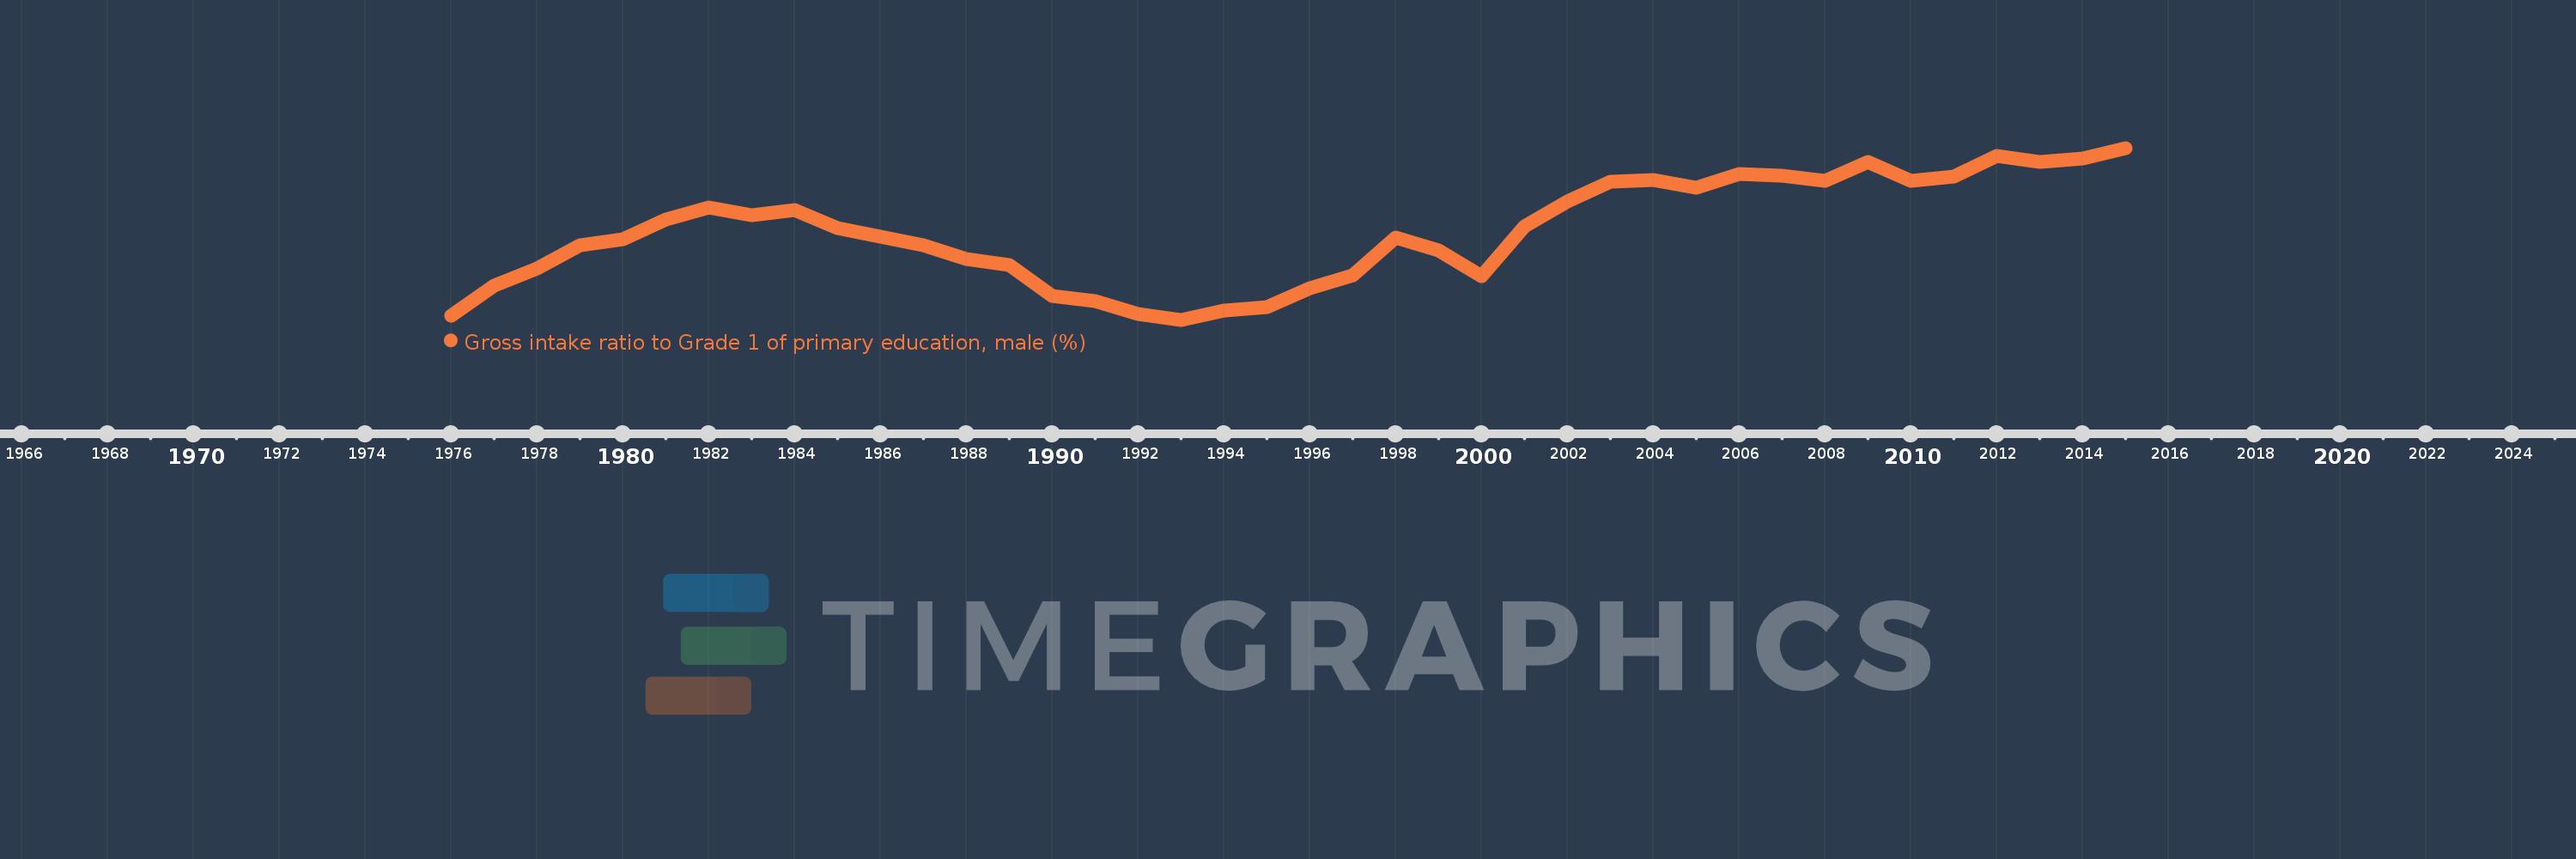
Gross intake ratio to Grade 1 of primary education, male (%)
2015,2014,2013,2012,2011,2010,2009,2008,2007,2006,2005,2004,2003,2002,2001,2000,1999,1998,1997,1996,1995,1994,1993,1992,1991,1990,1989,1988,1987,1986,1985,1984,1983,1982,1981,1980,1979,1978,1977,1976
This statistics in other country:
AfghanistanAlbaniaAlgeriaAngolaAntigua and BarbudaArab WorldArgentinaArmeniaArubaAustriaAzerbaijanBahamas, TheBahrainBangladeshBarbadosBelarusBelgiumBelizeBeninBermudaBhutanBoliviaBosnia and HerzegovinaBotswanaBrazilBrunei DarussalamBulgariaBurkina FasoBurundiCabo VerdeCambodiaCameroonCanadaCaribbean small statesCentral African RepublicCentral Europe and the BalticsChadChileChinaColombiaComorosCongo, Dem. Rep.Congo, Rep.Costa RicaCote d'IvoireCroatiaCubaCyprusCzech RepublicDenmarkDjiboutiDominicaDominican RepublicEarly-demographic dividendEast Asia & PacificEast Asia & Pacific (excluding high income)East Asia & Pacific (IDA & IBRD countries)EcuadorEgypt, Arab Rep.El SalvadorEquatorial GuineaEritreaEstoniaEthiopiaEuro areaEurope & Central AsiaEurope & Central Asia (excluding high income)Europe & Central Asia (IDA & IBRD countries)European UnionFijiFinlandFragile and conflict affected situationsFranceGabonGambia, TheGeorgiaGermanyGhanaGreeceGrenadaGuatemalaGuineaGuinea-BissauGuyanaHaitiHeavily indebted poor countries (HIPC)High incomeHondurasHong Kong SAR, ChinaHungaryIBRD onlyIcelandIDA & IBRD totalIDA blendIDA onlyIDA totalIndiaIndonesiaIran, Islamic Rep.IraqIrelandIsraelItalyJamaicaJapanJordanKazakhstanKenyaKiribatiKorea, Dem. People’s Rep.Korea, Rep.KuwaitKyrgyz RepublicLao PDRLate-demographic dividendLatin America & Caribbean Latin America & Caribbean (excluding high income)Latin America & the Caribbean (IDA & IBRD countries)LatviaLeast developed countries: UN classificationLebanonLesothoLiberiaLibyaLiechtensteinLithuaniaLow & middle incomeLow incomeLower middle incomeLuxembourgMacao SAR, ChinaMacedonia, FYRMadagascarMalawiMaldivesMaliMaltaMarshall IslandsMauritaniaMauritiusMexicoMicronesia, Fed. Sts.Middle East & North AfricaMiddle East & North Africa (excluding high income)Middle East & North Africa (IDA & IBRD countries)Middle incomeMoldovaMongoliaMontenegroMoroccoMozambiqueMyanmarNamibiaNauruNepalNetherlandsNew ZealandNicaraguaNigerNigeriaNorth AmericaNorwayOECD membersOmanOther small statesPacific island small statesPakistanPalauPanamaPapua New GuineaParaguayPeruPhilippinesPolandPortugalPost-demographic dividendPre-demographic dividendPuerto RicoQatarRomaniaRussian FederationRwandaSamoaSan MarinoSao Tome and PrincipeSaudi ArabiaSenegalSerbiaSeychellesSierra LeoneSlovak RepublicSloveniaSmall statesSolomon IslandsSouth AfricaSouth AsiaSouth Asia (IDA & IBRD)South SudanSpainSri LankaSt. Kitts and NevisSt. LuciaSt. Vincent and the GrenadinesSub-Saharan Africa Sub-Saharan Africa (excluding high income)Sub-Saharan Africa (IDA & IBRD countries)SudanSurinameSwazilandSwedenSwitzerlandSyrian Arab RepublicTajikistanTanzaniaThailandTimor-LesteTogoTongaTrinidad and TobagoTunisiaTurkeyTuvaluUgandaUkraineUnited Arab EmiratesUnited StatesUpper middle incomeUruguayUzbekistanVanuatuVenezuela, RBVietnamWest Bank and GazaWorldYemen, Rep.ZambiaZimbabwe Timeline:
This timeline shows a graph from 1976 to 2015 of IDA total. No data until 1975. Number of actual observations by date: 40.
Source name:
World Development Indicators
Source organization:
UNESCO Institute for Statistics
Categories, topics:
Education, Gender
Last updated:
apr 23, 2017
Indicators value changes by year
Minimum:
101.41
jan 1, 1993
Maximum:
119.241
jan 1, 2015
At the date of observation
Value
Absolute change
Change from previous value
jan 1, 1976
101.797
+101.797
0.0%
jan 1, 1977
104.953
+3.156
3.1%
jan 1, 1978
106.743
+1.791
1.71%
jan 1, 1979
109.142
+2.398
2.25%
jan 1, 1980
109.804
+0.662
0.61%
jan 1, 1981
111.828
+2.024
1.84%
jan 1, 1982
113.067
+1.239
1.11%
jan 1, 1983
112.218
-0.849
-0.75%
jan 1, 1984
112.776
+0.558
0.5%
jan 1, 1985
110.88
-1.896
-1.68%
jan 1, 1986
110.048
-0.832
-0.75%
jan 1, 1987
109.121
-0.927
-0.84%
jan 1, 1988
107.67
-1.45
-1.33%
jan 1, 1989
107.125
-0.545
-0.51%
jan 1, 1990
103.92
-3.205
-2.99%
jan 1, 1991
103.338
-0.582
-0.56%
jan 1, 1992
102.046
-1.292
-1.25%
jan 1, 1993
101.41
-0.636
-0.62%
jan 1, 1994
102.367
+0.957
0.94%
jan 1, 1995
102.724
+0.357
0.35%
jan 1, 1996
104.696
+1.972
1.92%
jan 1, 1997
105.981
+1.284
1.23%
jan 1, 1998
109.933
+3.952
3.73%
jan 1, 1999
108.588
-1.345
-1.22%
jan 1, 2000
105.949
-2.638
-2.43%
jan 1, 2001
111.136
+5.186
4.9%
jan 1, 2002
113.65
+2.515
2.26%
jan 1, 2003
115.773
+2.123
1.87%
jan 1, 2004
115.878
+0.105
0.09%
jan 1, 2005
115.083
-0.795
-0.69%
jan 1, 2006
116.502
+1.419
1.23%
jan 1, 2007
116.332
-0.169
-0.15%
jan 1, 2008
115.845
-0.488
-0.42%
jan 1, 2009
117.761
+1.916
1.65%
jan 1, 2010
115.792
-1.968
-1.67%
jan 1, 2011
116.287
+0.495
0.43%
jan 1, 2012
118.405
+2.118
1.82%
jan 1, 2013
117.829
-0.576
-0.49%
jan 1, 2014
118.156
+0.327
0.28%
jan 1, 2015
119.241
+1.085
0.92%
Ranking of countries by current statistics by years


Comments: