29
/
en
AIzaSyAYiBZKx7MnpbEhh9jyipgxe19OcubqV5w
April 1, 2024
264670
Togo
TGO
true
2
1
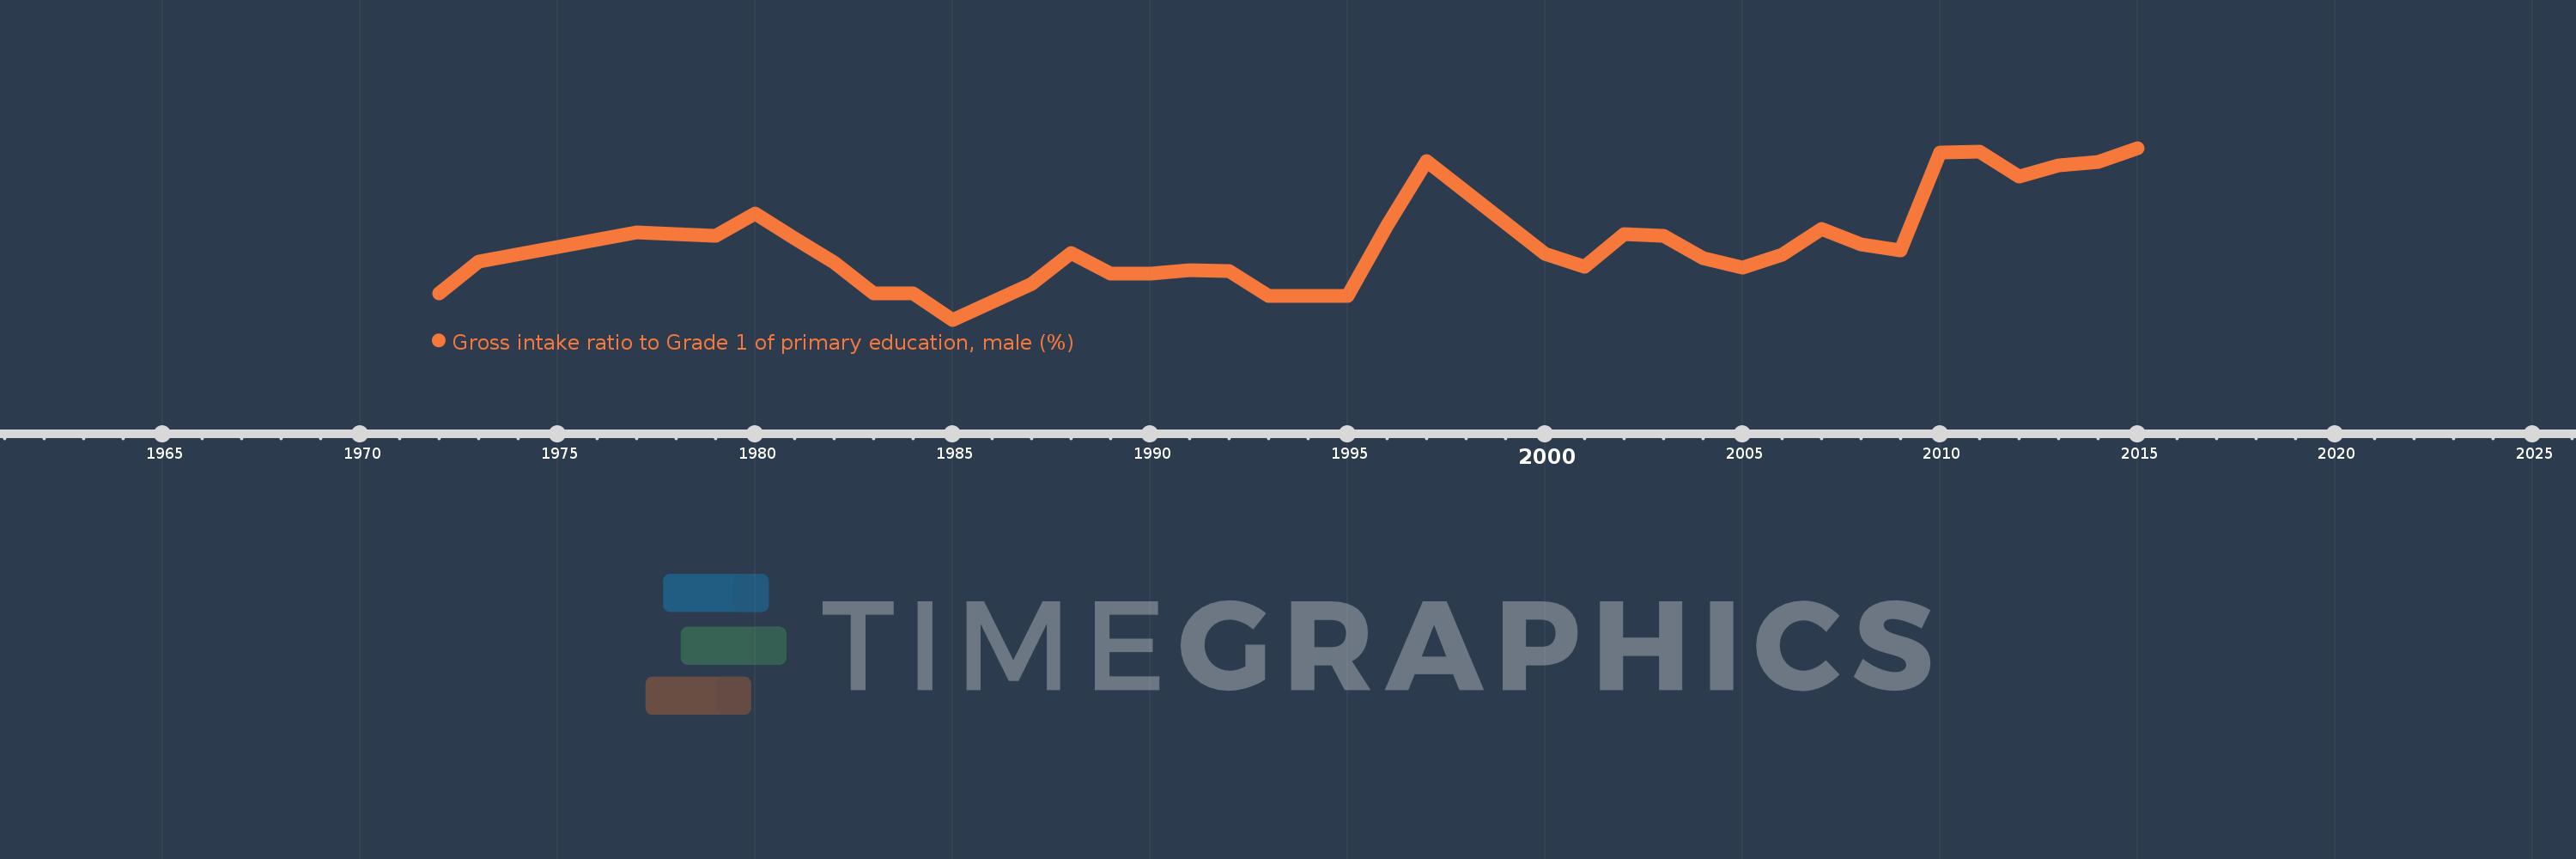
Gross intake ratio to Grade 1 of primary education, male (%)
2015,2014,2013,2012,2011,2010,2009,2008,2007,2006,2005,2004,2003,2002,2001,2000,1997,1996,1995,1993,1992,1991,1990,1989,1988,1987,1986,1985,1984,1983,1982,1981,1980,1979,1977,1973,1972
This statistics in other country:
AfghanistanAlbaniaAlgeriaAngolaAntigua and BarbudaArab WorldArgentinaArmeniaArubaAustriaAzerbaijanBahamas, TheBahrainBangladeshBarbadosBelarusBelgiumBelizeBeninBermudaBhutanBoliviaBosnia and HerzegovinaBotswanaBrazilBrunei DarussalamBulgariaBurkina FasoBurundiCabo VerdeCambodiaCameroonCanadaCaribbean small statesCentral African RepublicCentral Europe and the BalticsChadChileChinaColombiaComorosCongo, Dem. Rep.Congo, Rep.Costa RicaCote d'IvoireCroatiaCubaCyprusCzech RepublicDenmarkDjiboutiDominicaDominican RepublicEarly-demographic dividendEast Asia & PacificEast Asia & Pacific (excluding high income)East Asia & Pacific (IDA & IBRD countries)EcuadorEgypt, Arab Rep.El SalvadorEquatorial GuineaEritreaEstoniaEthiopiaEuro areaEurope & Central AsiaEurope & Central Asia (excluding high income)Europe & Central Asia (IDA & IBRD countries)European UnionFijiFinlandFragile and conflict affected situationsFranceGabonGambia, TheGeorgiaGermanyGhanaGreeceGrenadaGuatemalaGuineaGuinea-BissauGuyanaHaitiHeavily indebted poor countries (HIPC)High incomeHondurasHong Kong SAR, ChinaHungaryIBRD onlyIcelandIDA & IBRD totalIDA blendIDA onlyIDA totalIndiaIndonesiaIran, Islamic Rep.IraqIrelandIsraelItalyJamaicaJapanJordanKazakhstanKenyaKiribatiKorea, Dem. People’s Rep.Korea, Rep.KuwaitKyrgyz RepublicLao PDRLate-demographic dividendLatin America & Caribbean Latin America & Caribbean (excluding high income)Latin America & the Caribbean (IDA & IBRD countries)LatviaLeast developed countries: UN classificationLebanonLesothoLiberiaLibyaLiechtensteinLithuaniaLow & middle incomeLow incomeLower middle incomeLuxembourgMacao SAR, ChinaMacedonia, FYRMadagascarMalawiMaldivesMaliMaltaMarshall IslandsMauritaniaMauritiusMexicoMicronesia, Fed. Sts.Middle East & North AfricaMiddle East & North Africa (excluding high income)Middle East & North Africa (IDA & IBRD countries)Middle incomeMoldovaMongoliaMontenegroMoroccoMozambiqueMyanmarNamibiaNauruNepalNetherlandsNew ZealandNicaraguaNigerNigeriaNorth AmericaNorwayOECD membersOmanOther small statesPacific island small statesPakistanPalauPanamaPapua New GuineaParaguayPeruPhilippinesPolandPortugalPost-demographic dividendPre-demographic dividendPuerto RicoQatarRomaniaRussian FederationRwandaSamoaSan MarinoSao Tome and PrincipeSaudi ArabiaSenegalSerbiaSeychellesSierra LeoneSlovak RepublicSloveniaSmall statesSolomon IslandsSouth AfricaSouth AsiaSouth Asia (IDA & IBRD)South SudanSpainSri LankaSt. Kitts and NevisSt. LuciaSt. Vincent and the GrenadinesSub-Saharan Africa Sub-Saharan Africa (excluding high income)Sub-Saharan Africa (IDA & IBRD countries)SudanSurinameSwazilandSwedenSwitzerlandSyrian Arab RepublicTajikistanTanzaniaThailandTimor-LesteTogoTongaTrinidad and TobagoTunisiaTurkeyTuvaluUgandaUkraineUnited Arab EmiratesUnited StatesUpper middle incomeUruguayUzbekistanVanuatuVenezuela, RBVietnamWest Bank and GazaWorldYemen, Rep.ZambiaZimbabwe Timeline:
This timeline shows a graph from 1972 to 2015 of Togo. No data until 1971. Number of actual observations by date: 37.
Source name:
World Development Indicators
Source organization:
UNESCO Institute for Statistics
Categories, topics:
Education, Gender
Last updated:
apr 23, 2017
Indicators value changes by year
Minimum:
85.051
jan 1, 1985
Maximum:
139.689
jan 1, 2015
At the date of observation
Value
Absolute change
Change from previous value
jan 1, 1972
93.51
+93.51
0.0%
jan 1, 1973
103.44
+9.93
10.62%
jan 1, 1977
112.76
+9.32
9.01%
jan 1, 1979
111.625
-1.135
-1.01%
jan 1, 1980
118.796
+7.171
6.42%
jan 1, 1981
110.811
-7.984
-6.72%
jan 1, 1982
103.215
-7.596
-6.86%
jan 1, 1983
93.324
-9.891
-9.58%
jan 1, 1984
93.33
+0.006
0.01%
jan 1, 1985
85.051
-8.279
-8.87%
jan 1, 1986
90.649
+5.598
6.58%
jan 1, 1987
96.397
+5.748
6.34%
jan 1, 1988
106.169
+9.771
10.14%
jan 1, 1989
99.626
-6.543
-6.16%
jan 1, 1990
99.808
+0.182
0.18%
jan 1, 1991
100.805
+0.997
1.0%
jan 1, 1992
100.647
-0.158
-0.16%
jan 1, 1993
92.63
-8.018
-7.97%
jan 1, 1995
92.669
+0.039
0.04%
jan 1, 1996
114.909
+22.24
24.0%
jan 1, 1997
135.476
+20.568
17.9%
jan 1, 2000
105.883
-29.594
-21.84%
jan 1, 2001
101.905
-3.977
-3.76%
jan 1, 2002
112.413
+10.507
10.31%
jan 1, 2003
111.611
-0.802
-0.71%
jan 1, 2004
104.763
-6.847
-6.14%
jan 1, 2005
101.634
-3.129
-2.99%
jan 1, 2006
105.858
+4.224
4.16%
jan 1, 2007
113.96
+8.103
7.65%
jan 1, 2008
108.95
-5.011
-4.4%
jan 1, 2009
107.165
-1.785
-1.64%
jan 1, 2010
138.219
+31.054
28.98%
jan 1, 2011
138.457
+0.239
0.17%
jan 1, 2012
130.654
-7.803
-5.64%
jan 1, 2013
134.102
+3.448
2.64%
jan 1, 2014
135.131
+1.029
0.77%
jan 1, 2015
139.689
+4.558
3.37%
Ranking of countries by current statistics by years


Comments: