29
/
en
AIzaSyAYiBZKx7MnpbEhh9jyipgxe19OcubqV5w
April 1, 2024
201638
Morocco
MAR
true
2
1
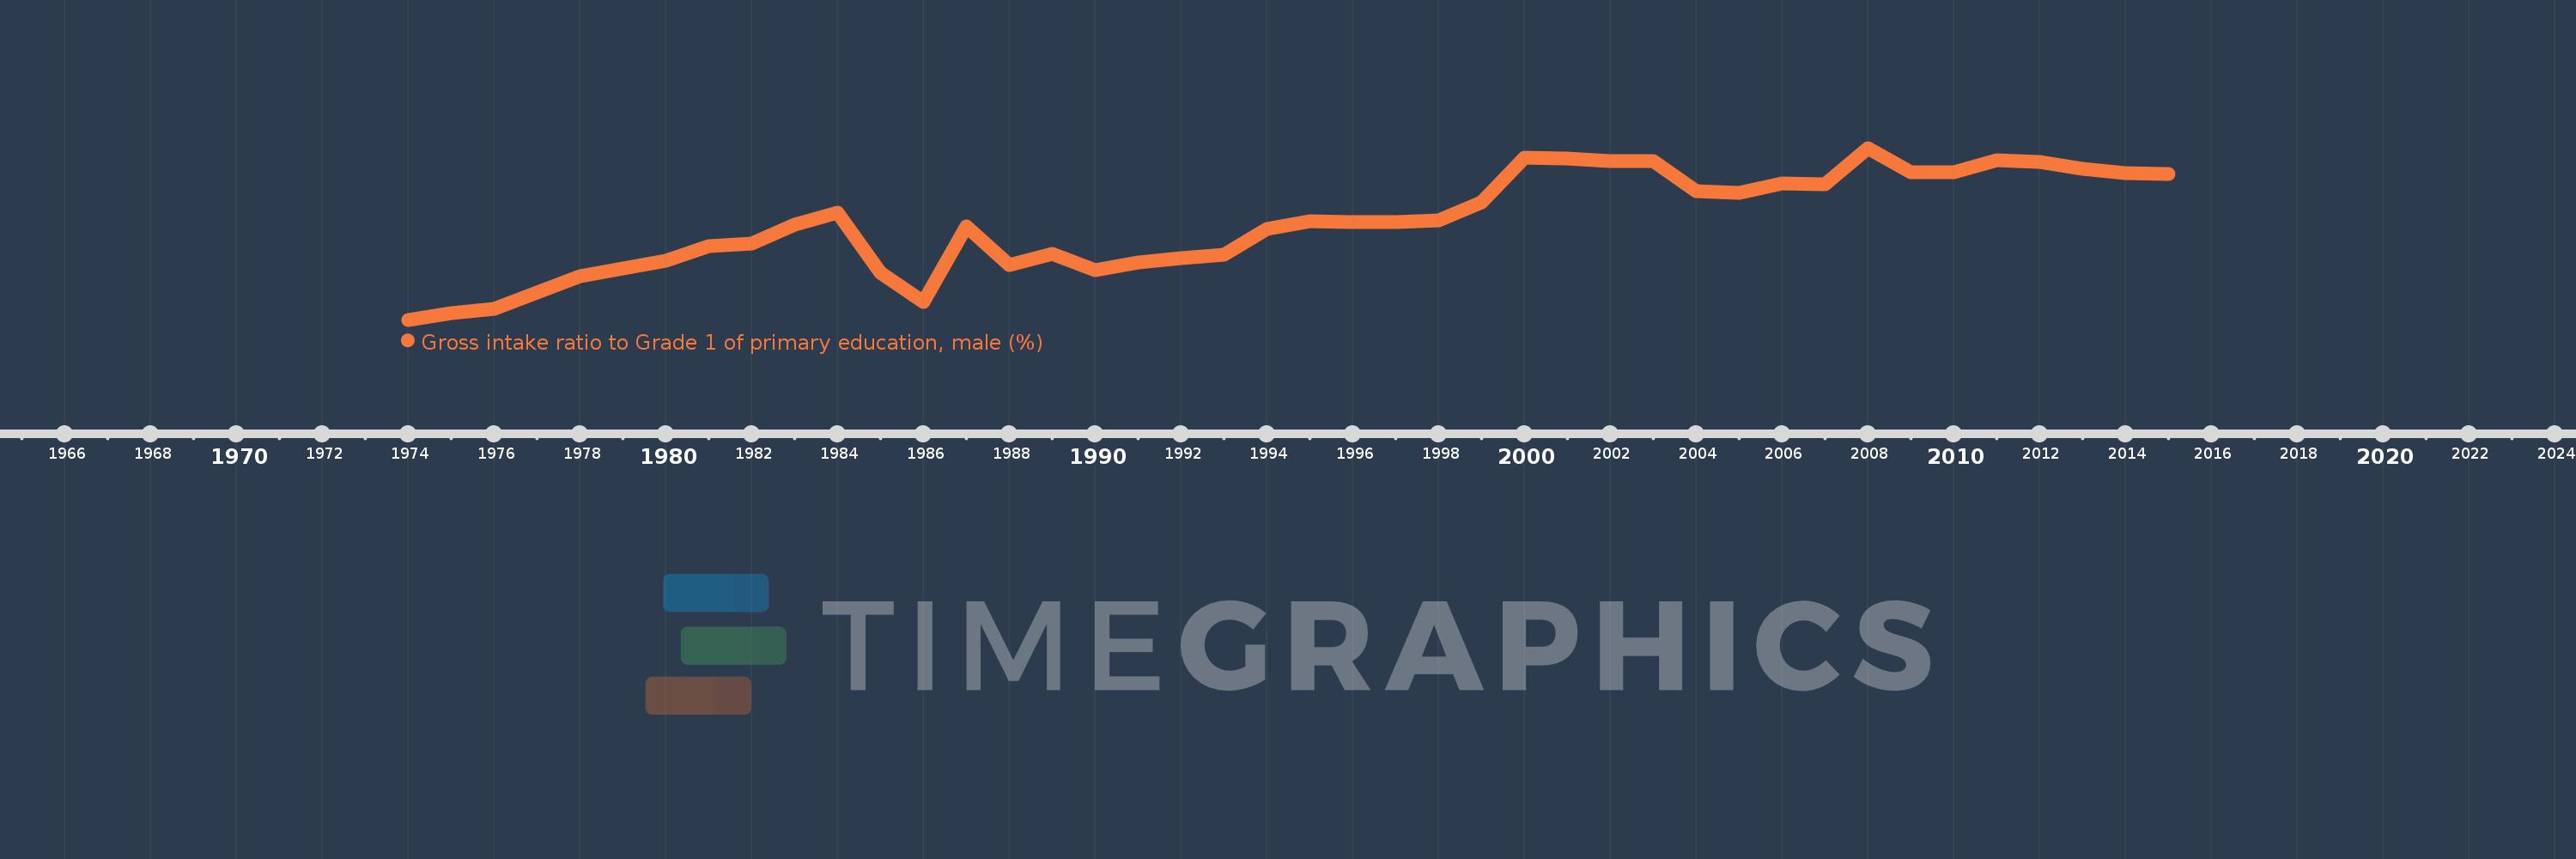
Gross intake ratio to Grade 1 of primary education, male (%)
2015,2014,2013,2012,2011,2010,2009,2008,2007,2006,2005,2004,2003,2002,2001,2000,1999,1998,1997,1996,1995,1994,1993,1992,1991,1990,1989,1988,1987,1986,1985,1984,1983,1982,1981,1980,1979,1978,1976,1975,1974
This statistics in other country:
AfghanistanAlbaniaAlgeriaAngolaAntigua and BarbudaArab WorldArgentinaArmeniaArubaAustriaAzerbaijanBahamas, TheBahrainBangladeshBarbadosBelarusBelgiumBelizeBeninBermudaBhutanBoliviaBosnia and HerzegovinaBotswanaBrazilBrunei DarussalamBulgariaBurkina FasoBurundiCabo VerdeCambodiaCameroonCanadaCaribbean small statesCentral African RepublicCentral Europe and the BalticsChadChileChinaColombiaComorosCongo, Dem. Rep.Congo, Rep.Costa RicaCote d'IvoireCroatiaCubaCyprusCzech RepublicDenmarkDjiboutiDominicaDominican RepublicEarly-demographic dividendEast Asia & PacificEast Asia & Pacific (excluding high income)East Asia & Pacific (IDA & IBRD countries)EcuadorEgypt, Arab Rep.El SalvadorEquatorial GuineaEritreaEstoniaEthiopiaEuro areaEurope & Central AsiaEurope & Central Asia (excluding high income)Europe & Central Asia (IDA & IBRD countries)European UnionFijiFinlandFragile and conflict affected situationsFranceGabonGambia, TheGeorgiaGermanyGhanaGreeceGrenadaGuatemalaGuineaGuinea-BissauGuyanaHaitiHeavily indebted poor countries (HIPC)High incomeHondurasHong Kong SAR, ChinaHungaryIBRD onlyIcelandIDA & IBRD totalIDA blendIDA onlyIDA totalIndiaIndonesiaIran, Islamic Rep.IraqIrelandIsraelItalyJamaicaJapanJordanKazakhstanKenyaKiribatiKorea, Dem. People’s Rep.Korea, Rep.KuwaitKyrgyz RepublicLao PDRLate-demographic dividendLatin America & Caribbean Latin America & Caribbean (excluding high income)Latin America & the Caribbean (IDA & IBRD countries)LatviaLeast developed countries: UN classificationLebanonLesothoLiberiaLibyaLiechtensteinLithuaniaLow & middle incomeLow incomeLower middle incomeLuxembourgMacao SAR, ChinaMacedonia, FYRMadagascarMalawiMaldivesMaliMaltaMarshall IslandsMauritaniaMauritiusMexicoMicronesia, Fed. Sts.Middle East & North AfricaMiddle East & North Africa (excluding high income)Middle East & North Africa (IDA & IBRD countries)Middle incomeMoldovaMongoliaMontenegroMoroccoMozambiqueMyanmarNamibiaNauruNepalNetherlandsNew ZealandNicaraguaNigerNigeriaNorth AmericaNorwayOECD membersOmanOther small statesPacific island small statesPakistanPalauPanamaPapua New GuineaParaguayPeruPhilippinesPolandPortugalPost-demographic dividendPre-demographic dividendPuerto RicoQatarRomaniaRussian FederationRwandaSamoaSan MarinoSao Tome and PrincipeSaudi ArabiaSenegalSerbiaSeychellesSierra LeoneSlovak RepublicSloveniaSmall statesSolomon IslandsSouth AfricaSouth AsiaSouth Asia (IDA & IBRD)South SudanSpainSri LankaSt. Kitts and NevisSt. LuciaSt. Vincent and the GrenadinesSub-Saharan Africa Sub-Saharan Africa (excluding high income)Sub-Saharan Africa (IDA & IBRD countries)SudanSurinameSwazilandSwedenSwitzerlandSyrian Arab RepublicTajikistanTanzaniaThailandTimor-LesteTogoTongaTrinidad and TobagoTunisiaTurkeyTuvaluUgandaUkraineUnited Arab EmiratesUnited StatesUpper middle incomeUruguayUzbekistanVanuatuVenezuela, RBVietnamWest Bank and GazaWorldYemen, Rep.ZambiaZimbabwe Timeline:
This timeline shows a graph from 1974 to 2015 of Morocco. No data until 1973. Number of actual observations by date: 41.
Source name:
World Development Indicators
Source organization:
UNESCO Institute for Statistics
Categories, topics:
Education, Gender
Last updated:
apr 23, 2017
Indicators value changes by year
Minimum:
57.039
jan 1, 1974
Maximum:
116.295
jan 1, 2008
At the date of observation
Value
Absolute change
Change from previous value
jan 1, 1974
57.039
+57.039
0.0%
jan 1, 1975
59.361
+2.322
4.07%
jan 1, 1976
60.671
+1.31
2.21%
jan 1, 1978
71.972
+11.301
18.63%
jan 1, 1979
74.753
+2.781
3.86%
jan 1, 1980
77.54
+2.787
3.73%
jan 1, 1981
82.55
+5.01
6.46%
jan 1, 1982
83.44
+0.89
1.08%
jan 1, 1983
89.907
+6.467
7.75%
jan 1, 1984
94.114
+4.207
4.68%
jan 1, 1985
73.169
-20.945
-22.25%
jan 1, 1986
63.123
-10.046
-13.73%
jan 1, 1987
89.262
+26.139
41.41%
jan 1, 1988
75.993
-13.269
-14.86%
jan 1, 1989
79.866
+3.873
5.1%
jan 1, 1990
74.066
-5.8
-7.26%
jan 1, 1991
76.816
+2.75
3.71%
jan 1, 1992
78.287
+1.472
1.92%
jan 1, 1993
79.321
+1.034
1.32%
jan 1, 1994
88.414
+9.093
11.46%
jan 1, 1995
91.058
+2.643
2.99%
jan 1, 1996
90.846
-0.212
-0.23%
jan 1, 1997
90.789
-0.057
-0.06%
jan 1, 1998
91.335
+0.546
0.6%
jan 1, 1999
97.635
+6.3
6.9%
jan 1, 2000
112.94
+15.305
15.68%
jan 1, 2001
112.567
-0.373
-0.33%
jan 1, 2002
111.731
-0.835
-0.74%
jan 1, 2003
111.735
+0.004
0.0%
jan 1, 2004
101.415
-10.32
-9.24%
jan 1, 2005
100.851
-0.564
-0.56%
jan 1, 2006
104.007
+3.156
3.13%
jan 1, 2007
103.827
-0.18
-0.17%
jan 1, 2008
116.295
+12.467
12.01%
jan 1, 2009
107.934
-8.361
-7.19%
jan 1, 2010
107.972
+0.038
0.04%
jan 1, 2011
111.911
+3.939
3.65%
jan 1, 2012
111.598
-0.314
-0.28%
jan 1, 2013
109.007
-2.591
-2.32%
jan 1, 2014
107.602
-1.406
-1.29%
jan 1, 2015
107.256
-0.346
-0.32%
Ranking of countries by current statistics by years


Comments: