29
/
en
AIzaSyAYiBZKx7MnpbEhh9jyipgxe19OcubqV5w
April 1, 2024
227474
Qatar
QAT
true
2
1
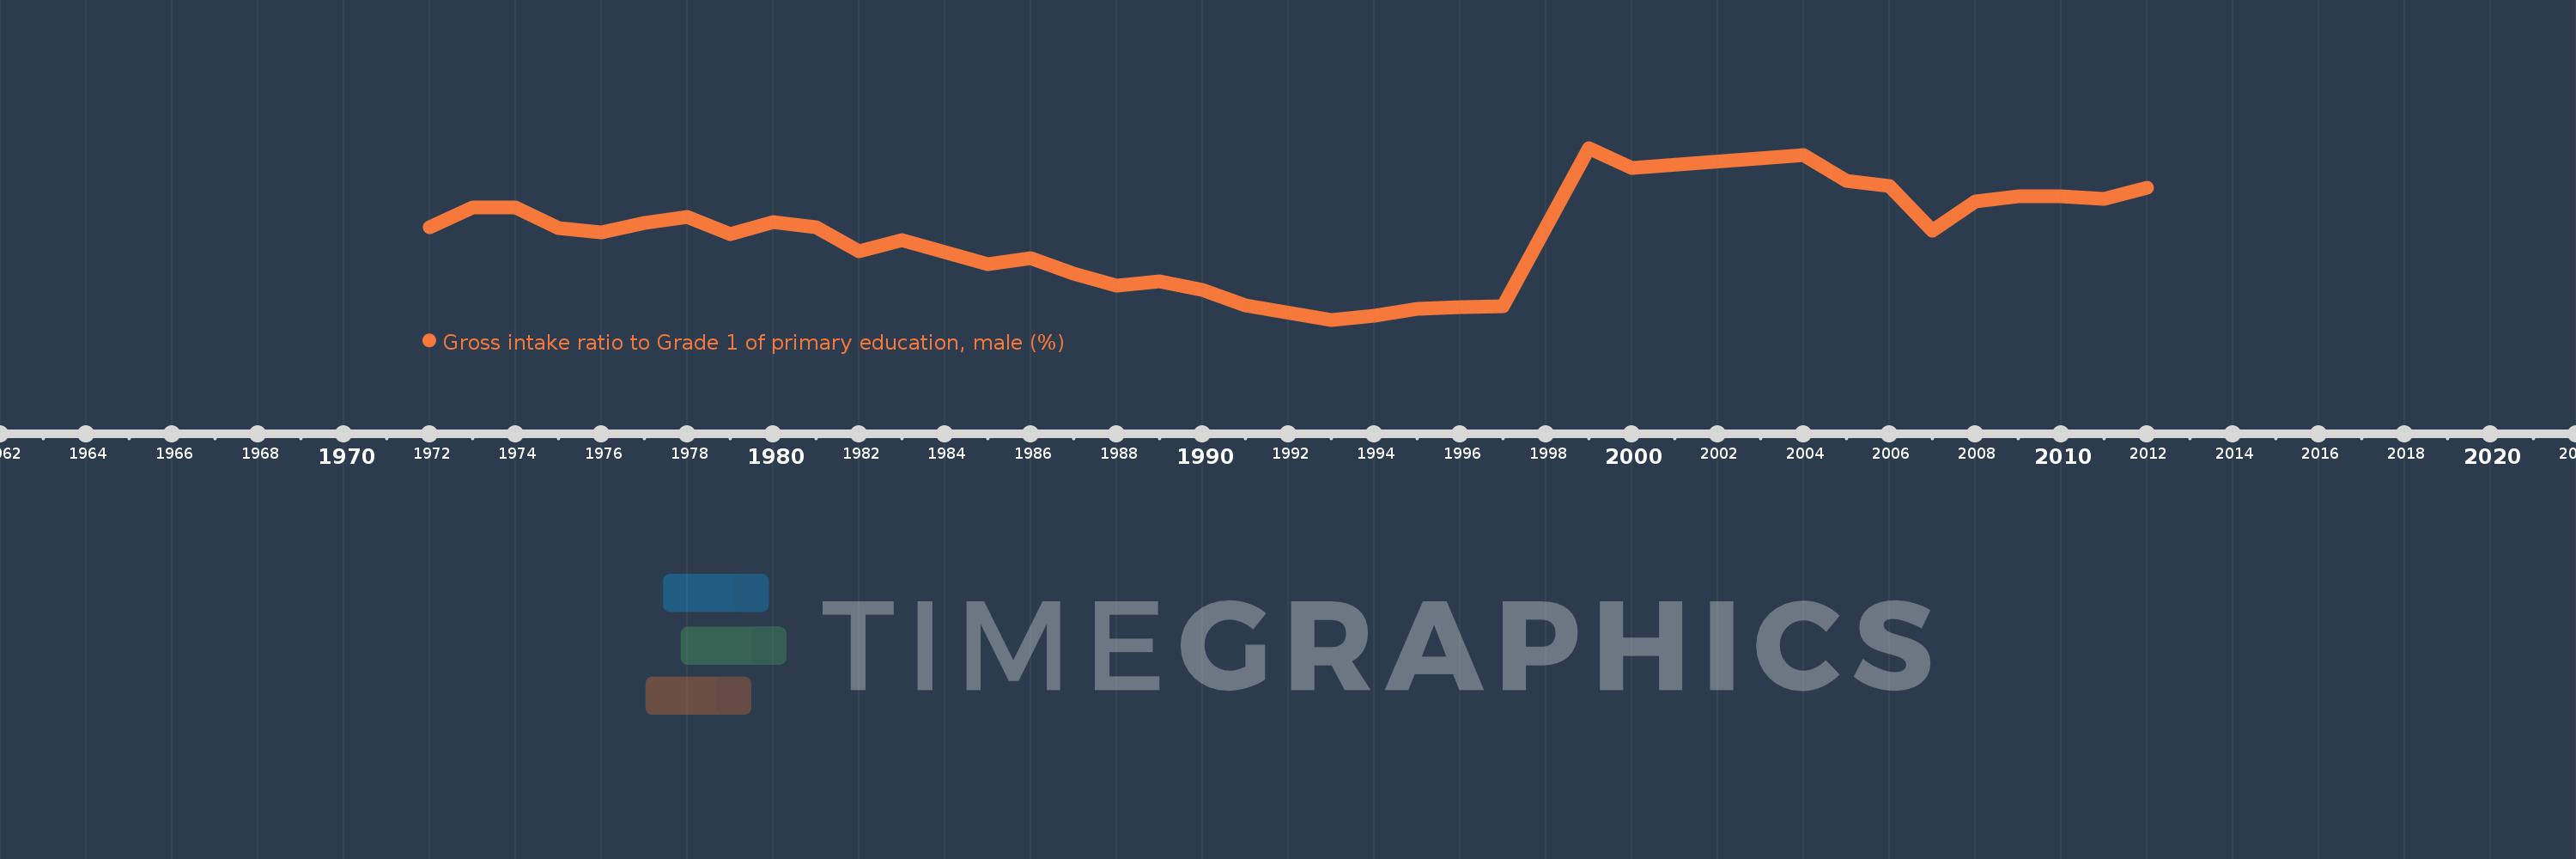
Gross intake ratio to Grade 1 of primary education, male (%)
2012,2011,2010,2009,2008,2007,2006,2005,2004,2000,1999,1997,1996,1995,1994,1993,1991,1990,1989,1988,1987,1986,1985,1983,1982,1981,1980,1979,1978,1977,1976,1975,1974,1973,1972
This statistics in other country:
AfghanistanAlbaniaAlgeriaAngolaAntigua and BarbudaArab WorldArgentinaArmeniaArubaAustriaAzerbaijanBahamas, TheBahrainBangladeshBarbadosBelarusBelgiumBelizeBeninBermudaBhutanBoliviaBosnia and HerzegovinaBotswanaBrazilBrunei DarussalamBulgariaBurkina FasoBurundiCabo VerdeCambodiaCameroonCanadaCaribbean small statesCentral African RepublicCentral Europe and the BalticsChadChileChinaColombiaComorosCongo, Dem. Rep.Congo, Rep.Costa RicaCote d'IvoireCroatiaCubaCyprusCzech RepublicDenmarkDjiboutiDominicaDominican RepublicEarly-demographic dividendEast Asia & PacificEast Asia & Pacific (excluding high income)East Asia & Pacific (IDA & IBRD countries)EcuadorEgypt, Arab Rep.El SalvadorEquatorial GuineaEritreaEstoniaEthiopiaEuro areaEurope & Central AsiaEurope & Central Asia (excluding high income)Europe & Central Asia (IDA & IBRD countries)European UnionFijiFinlandFragile and conflict affected situationsFranceGabonGambia, TheGeorgiaGermanyGhanaGreeceGrenadaGuatemalaGuineaGuinea-BissauGuyanaHaitiHeavily indebted poor countries (HIPC)High incomeHondurasHong Kong SAR, ChinaHungaryIBRD onlyIcelandIDA & IBRD totalIDA blendIDA onlyIDA totalIndiaIndonesiaIran, Islamic Rep.IraqIrelandIsraelItalyJamaicaJapanJordanKazakhstanKenyaKiribatiKorea, Dem. People’s Rep.Korea, Rep.KuwaitKyrgyz RepublicLao PDRLate-demographic dividendLatin America & Caribbean Latin America & Caribbean (excluding high income)Latin America & the Caribbean (IDA & IBRD countries)LatviaLeast developed countries: UN classificationLebanonLesothoLiberiaLibyaLiechtensteinLithuaniaLow & middle incomeLow incomeLower middle incomeLuxembourgMacao SAR, ChinaMacedonia, FYRMadagascarMalawiMaldivesMaliMaltaMarshall IslandsMauritaniaMauritiusMexicoMicronesia, Fed. Sts.Middle East & North AfricaMiddle East & North Africa (excluding high income)Middle East & North Africa (IDA & IBRD countries)Middle incomeMoldovaMongoliaMontenegroMoroccoMozambiqueMyanmarNamibiaNauruNepalNetherlandsNew ZealandNicaraguaNigerNigeriaNorth AmericaNorwayOECD membersOmanOther small statesPacific island small statesPakistanPalauPanamaPapua New GuineaParaguayPeruPhilippinesPolandPortugalPost-demographic dividendPre-demographic dividendPuerto RicoQatarRomaniaRussian FederationRwandaSamoaSan MarinoSao Tome and PrincipeSaudi ArabiaSenegalSerbiaSeychellesSierra LeoneSlovak RepublicSloveniaSmall statesSolomon IslandsSouth AfricaSouth AsiaSouth Asia (IDA & IBRD)South SudanSpainSri LankaSt. Kitts and NevisSt. LuciaSt. Vincent and the GrenadinesSub-Saharan Africa Sub-Saharan Africa (excluding high income)Sub-Saharan Africa (IDA & IBRD countries)SudanSurinameSwazilandSwedenSwitzerlandSyrian Arab RepublicTajikistanTanzaniaThailandTimor-LesteTogoTongaTrinidad and TobagoTunisiaTurkeyTuvaluUgandaUkraineUnited Arab EmiratesUnited StatesUpper middle incomeUruguayUzbekistanVanuatuVenezuela, RBVietnamWest Bank and GazaWorldYemen, Rep.ZambiaZimbabwe Timeline:
This timeline shows a graph from 1972 to 2012 of Qatar. No data until 1971. Number of actual observations by date: 35.
Source name:
World Development Indicators
Source organization:
UNESCO Institute for Statistics
Categories, topics:
Education, Gender
Last updated:
apr 23, 2017
Indicators value changes by year
Minimum:
51.755
jan 1, 1993
Maximum:
121.215
jan 1, 1999
At the date of observation
Value
Absolute change
Change from previous value
jan 1, 1972
89.275
+89.275
0.0%
jan 1, 1973
97.104
+7.829
8.77%
jan 1, 1974
97.309
+0.205
0.21%
jan 1, 1975
88.921
-8.388
-8.62%
jan 1, 1976
87.145
-1.776
-2.0%
jan 1, 1977
90.894
+3.749
4.3%
jan 1, 1978
93.337
+2.442
2.69%
jan 1, 1979
86.464
-6.873
-7.36%
jan 1, 1980
91.302
+4.838
5.6%
jan 1, 1981
89.242
-2.06
-2.26%
jan 1, 1982
79.514
-9.728
-10.9%
jan 1, 1983
83.982
+4.468
5.62%
jan 1, 1985
74.204
-9.779
-11.64%
jan 1, 1986
76.594
+2.39
3.22%
jan 1, 1987
70.248
-6.346
-8.29%
jan 1, 1988
65.616
-4.632
-6.59%
jan 1, 1989
67.185
+1.569
2.39%
jan 1, 1990
63.876
-3.308
-4.92%
jan 1, 1991
57.382
-6.494
-10.17%
jan 1, 1993
51.755
-5.627
-9.81%
jan 1, 1994
53.321
+1.565
3.02%
jan 1, 1995
56.214
+2.894
5.43%
jan 1, 1996
56.815
+0.601
1.07%
jan 1, 1997
57.092
+0.277
0.49%
jan 1, 1999
121.215
+64.123
112.32%
jan 1, 2000
113.193
-8.022
-6.62%
jan 1, 2004
118.198
+5.005
4.42%
jan 1, 2005
107.917
-10.281
-8.7%
jan 1, 2006
105.662
-2.256
-2.09%
jan 1, 2007
87.852
-17.81
-16.86%
jan 1, 2008
99.69
+11.838
13.48%
jan 1, 2009
101.6
+1.91
1.92%
jan 1, 2010
101.795
+0.196
0.19%
jan 1, 2011
100.594
-1.202
-1.18%
jan 1, 2012
105.142
+4.549
4.52%
Ranking of countries by current statistics by years


Comments: