29
/
en
AIzaSyAYiBZKx7MnpbEhh9jyipgxe19OcubqV5w
April 1, 2024
47177
Lower middle income
LMC
false
2
1
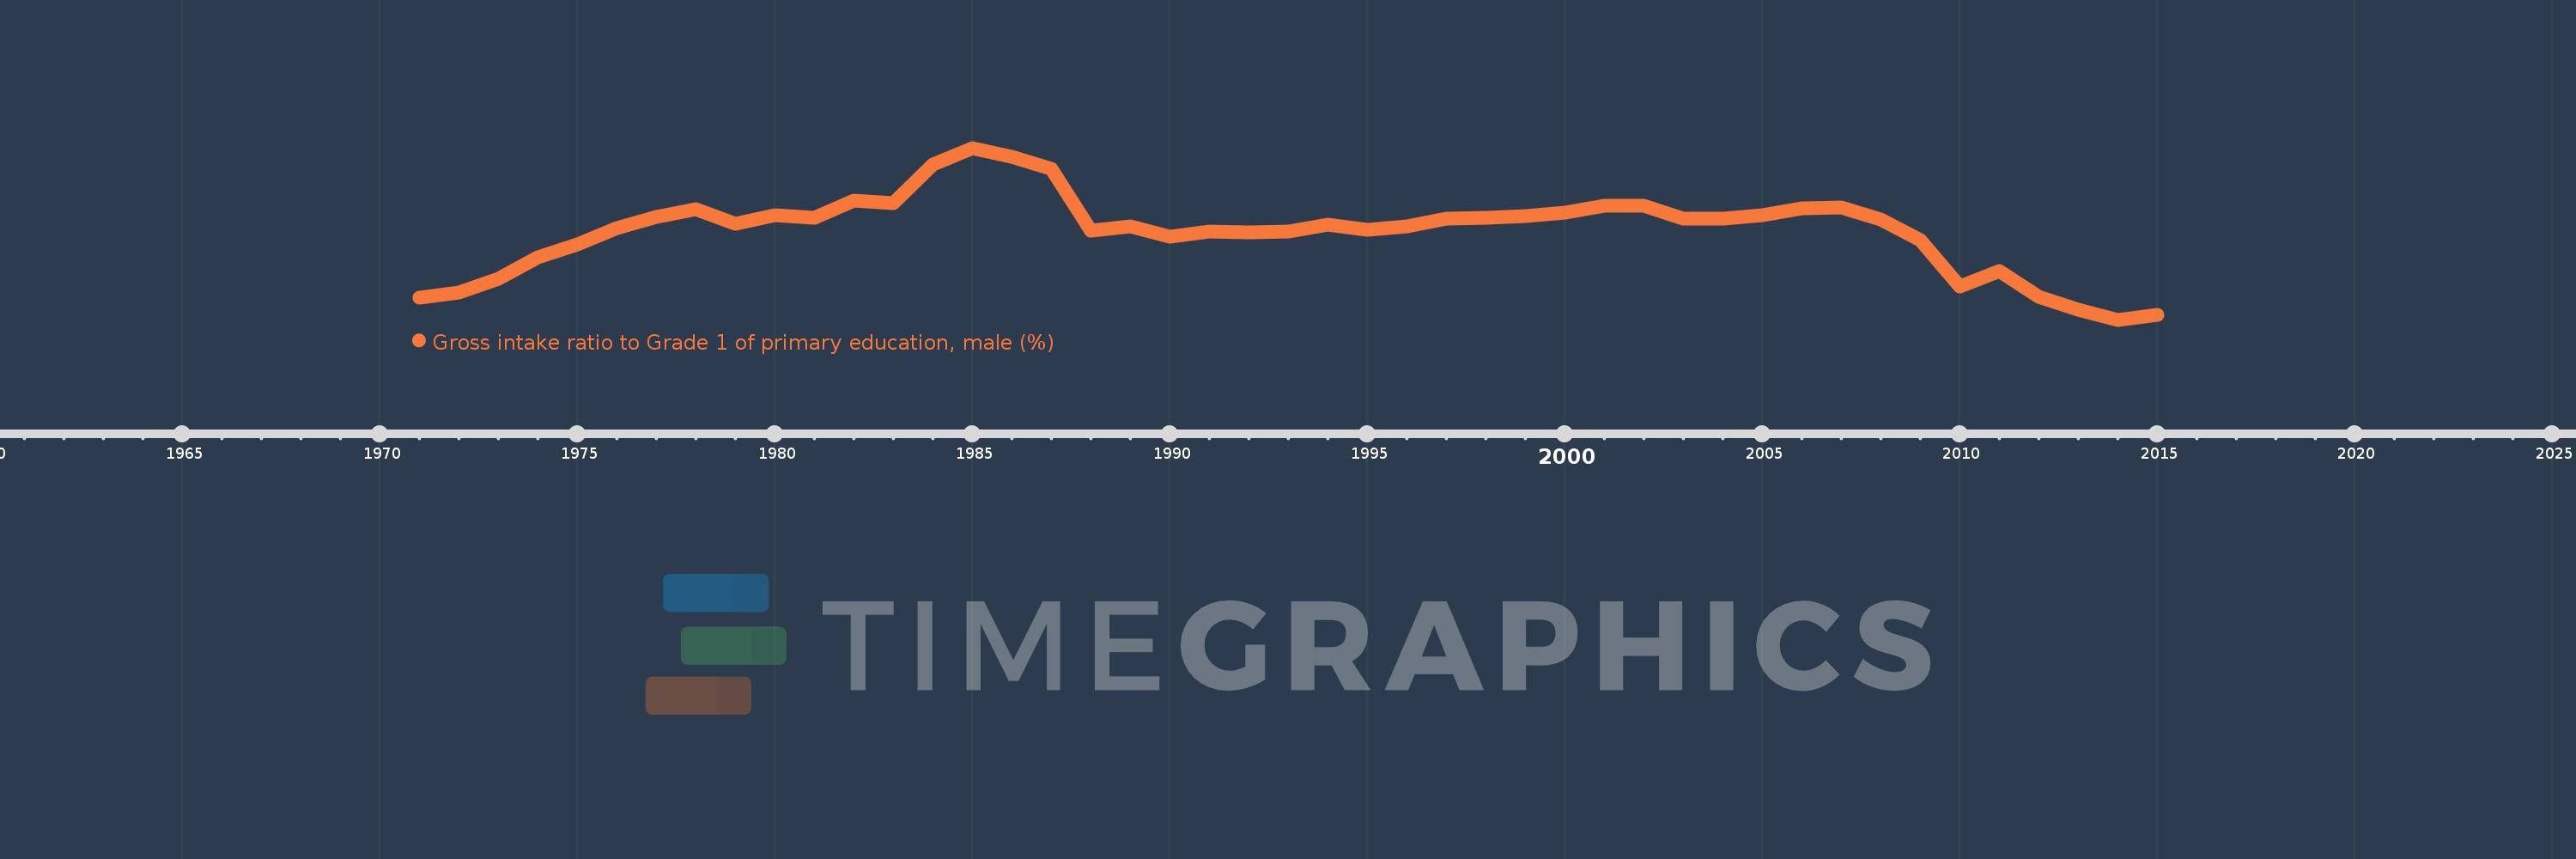
Gross intake ratio to Grade 1 of primary education, male (%)
2015,2014,2013,2012,2011,2010,2009,2008,2007,2006,2005,2004,2003,2002,2001,2000,1999,1998,1997,1996,1995,1994,1993,1992,1991,1990,1989,1988,1987,1986,1985,1984,1983,1982,1981,1980,1979,1978,1977,1976,1975,1974,1973,1972,1971
This statistics in other country:
AfghanistanAlbaniaAlgeriaAngolaAntigua and BarbudaArab WorldArgentinaArmeniaArubaAustriaAzerbaijanBahamas, TheBahrainBangladeshBarbadosBelarusBelgiumBelizeBeninBermudaBhutanBoliviaBosnia and HerzegovinaBotswanaBrazilBrunei DarussalamBulgariaBurkina FasoBurundiCabo VerdeCambodiaCameroonCanadaCaribbean small statesCentral African RepublicCentral Europe and the BalticsChadChileChinaColombiaComorosCongo, Dem. Rep.Congo, Rep.Costa RicaCote d'IvoireCroatiaCubaCyprusCzech RepublicDenmarkDjiboutiDominicaDominican RepublicEarly-demographic dividendEast Asia & PacificEast Asia & Pacific (excluding high income)East Asia & Pacific (IDA & IBRD countries)EcuadorEgypt, Arab Rep.El SalvadorEquatorial GuineaEritreaEstoniaEthiopiaEuro areaEurope & Central AsiaEurope & Central Asia (excluding high income)Europe & Central Asia (IDA & IBRD countries)European UnionFijiFinlandFragile and conflict affected situationsFranceGabonGambia, TheGeorgiaGermanyGhanaGreeceGrenadaGuatemalaGuineaGuinea-BissauGuyanaHaitiHeavily indebted poor countries (HIPC)High incomeHondurasHong Kong SAR, ChinaHungaryIBRD onlyIcelandIDA & IBRD totalIDA blendIDA onlyIDA totalIndiaIndonesiaIran, Islamic Rep.IraqIrelandIsraelItalyJamaicaJapanJordanKazakhstanKenyaKiribatiKorea, Dem. People’s Rep.Korea, Rep.KuwaitKyrgyz RepublicLao PDRLate-demographic dividendLatin America & Caribbean Latin America & Caribbean (excluding high income)Latin America & the Caribbean (IDA & IBRD countries)LatviaLeast developed countries: UN classificationLebanonLesothoLiberiaLibyaLiechtensteinLithuaniaLow & middle incomeLow incomeLower middle incomeLuxembourgMacao SAR, ChinaMacedonia, FYRMadagascarMalawiMaldivesMaliMaltaMarshall IslandsMauritaniaMauritiusMexicoMicronesia, Fed. Sts.Middle East & North AfricaMiddle East & North Africa (excluding high income)Middle East & North Africa (IDA & IBRD countries)Middle incomeMoldovaMongoliaMontenegroMoroccoMozambiqueMyanmarNamibiaNauruNepalNetherlandsNew ZealandNicaraguaNigerNigeriaNorth AmericaNorwayOECD membersOmanOther small statesPacific island small statesPakistanPalauPanamaPapua New GuineaParaguayPeruPhilippinesPolandPortugalPost-demographic dividendPre-demographic dividendPuerto RicoQatarRomaniaRussian FederationRwandaSamoaSan MarinoSao Tome and PrincipeSaudi ArabiaSenegalSerbiaSeychellesSierra LeoneSlovak RepublicSloveniaSmall statesSolomon IslandsSouth AfricaSouth AsiaSouth Asia (IDA & IBRD)South SudanSpainSri LankaSt. Kitts and NevisSt. LuciaSt. Vincent and the GrenadinesSub-Saharan Africa Sub-Saharan Africa (excluding high income)Sub-Saharan Africa (IDA & IBRD countries)SudanSurinameSwazilandSwedenSwitzerlandSyrian Arab RepublicTajikistanTanzaniaThailandTimor-LesteTogoTongaTrinidad and TobagoTunisiaTurkeyTuvaluUgandaUkraineUnited Arab EmiratesUnited StatesUpper middle incomeUruguayUzbekistanVanuatuVenezuela, RBVietnamWest Bank and GazaWorldYemen, Rep.ZambiaZimbabwe Timeline:
This timeline shows a graph from 1971 to 2015 of Lower middle income. No data until 1970. Number of actual observations by date: 45.
Source name:
World Development Indicators
Source organization:
UNESCO Institute for Statistics
Categories, topics:
Education, Gender
Last updated:
apr 23, 2017
Indicators value changes by year
Minimum:
105.748
jan 1, 2014
Maximum:
128.999
jan 1, 1985
At the date of observation
Value
Absolute change
Change from previous value
jan 1, 1971
108.742
+108.742
0.0%
jan 1, 1972
109.437
+0.694
0.64%
jan 1, 1973
111.308
+1.871
1.71%
jan 1, 1974
114.221
+2.913
2.62%
jan 1, 1975
115.891
+1.67
1.46%
jan 1, 1976
118.187
+2.296
1.98%
jan 1, 1977
119.662
+1.474
1.25%
jan 1, 1978
120.714
+1.052
0.88%
jan 1, 1979
118.684
-2.03
-1.68%
jan 1, 1980
119.853
+1.169
0.98%
jan 1, 1981
119.511
-0.342
-0.29%
jan 1, 1982
121.893
+2.382
1.99%
jan 1, 1983
121.532
-0.361
-0.3%
jan 1, 1984
126.763
+5.231
4.3%
jan 1, 1985
128.999
+2.236
1.76%
jan 1, 1986
127.767
-1.232
-0.96%
jan 1, 1987
126.149
-1.618
-1.27%
jan 1, 1988
117.774
-8.375
-6.64%
jan 1, 1989
118.368
+0.595
0.51%
jan 1, 1990
117.026
-1.342
-1.13%
jan 1, 1991
117.655
+0.628
0.54%
jan 1, 1992
117.535
-0.12
-0.1%
jan 1, 1993
117.709
+0.174
0.15%
jan 1, 1994
118.626
+0.917
0.78%
jan 1, 1995
117.895
-0.73
-0.62%
jan 1, 1996
118.329
+0.434
0.37%
jan 1, 1997
119.432
+1.103
0.93%
jan 1, 1998
119.583
+0.151
0.13%
jan 1, 1999
119.736
+0.153
0.13%
jan 1, 2000
120.231
+0.494
0.41%
jan 1, 2001
121.202
+0.971
0.81%
jan 1, 2002
121.143
-0.058
-0.05%
jan 1, 2003
119.472
-1.671
-1.38%
jan 1, 2004
119.456
-0.016
-0.01%
jan 1, 2005
119.839
+0.383
0.32%
jan 1, 2006
120.836
+0.997
0.83%
jan 1, 2007
120.969
+0.133
0.11%
jan 1, 2008
119.349
-1.621
-1.34%
jan 1, 2009
116.54
-2.809
-2.35%
jan 1, 2010
110.255
-6.285
-5.39%
jan 1, 2011
112.363
+2.108
1.91%
jan 1, 2012
108.884
-3.48
-3.1%
jan 1, 2013
107.1
-1.784
-1.64%
jan 1, 2014
105.748
-1.352
-1.26%
jan 1, 2015
106.407
+0.659
0.62%
Ranking of countries by current statistics by years


Comments: