29
/
en
AIzaSyAYiBZKx7MnpbEhh9jyipgxe19OcubqV5w
April 1, 2024
61658
Upper middle income
UMC
false
2
1
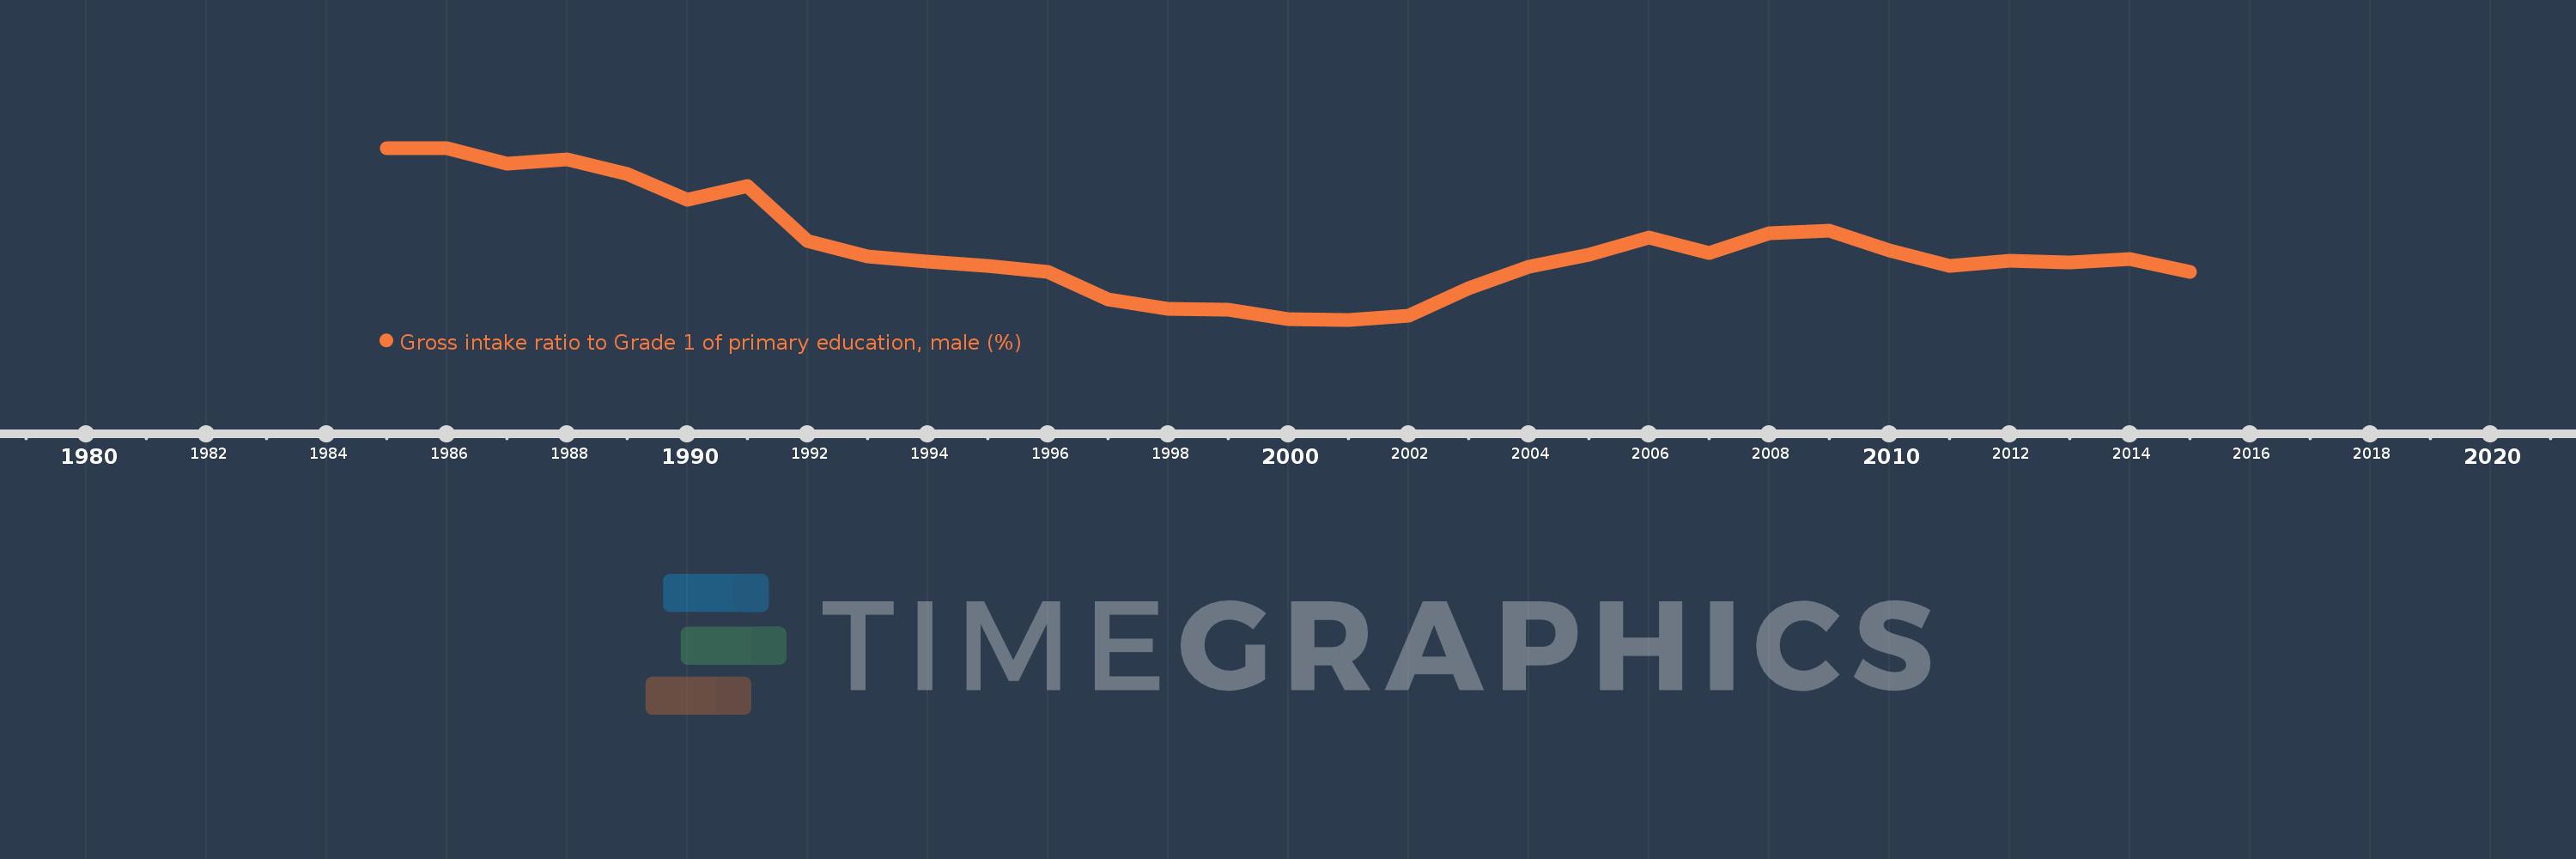
Gross intake ratio to Grade 1 of primary education, male (%)
2015,2014,2013,2012,2011,2010,2009,2008,2007,2006,2005,2004,2003,2002,2001,2000,1999,1998,1997,1996,1995,1994,1993,1992,1991,1990,1989,1988,1987,1986,1985
This statistics in other country:
AfghanistanAlbaniaAlgeriaAngolaAntigua and BarbudaArab WorldArgentinaArmeniaArubaAustriaAzerbaijanBahamas, TheBahrainBangladeshBarbadosBelarusBelgiumBelizeBeninBermudaBhutanBoliviaBosnia and HerzegovinaBotswanaBrazilBrunei DarussalamBulgariaBurkina FasoBurundiCabo VerdeCambodiaCameroonCanadaCaribbean small statesCentral African RepublicCentral Europe and the BalticsChadChileChinaColombiaComorosCongo, Dem. Rep.Congo, Rep.Costa RicaCote d'IvoireCroatiaCubaCyprusCzech RepublicDenmarkDjiboutiDominicaDominican RepublicEarly-demographic dividendEast Asia & PacificEast Asia & Pacific (excluding high income)East Asia & Pacific (IDA & IBRD countries)EcuadorEgypt, Arab Rep.El SalvadorEquatorial GuineaEritreaEstoniaEthiopiaEuro areaEurope & Central AsiaEurope & Central Asia (excluding high income)Europe & Central Asia (IDA & IBRD countries)European UnionFijiFinlandFragile and conflict affected situationsFranceGabonGambia, TheGeorgiaGermanyGhanaGreeceGrenadaGuatemalaGuineaGuinea-BissauGuyanaHaitiHeavily indebted poor countries (HIPC)High incomeHondurasHong Kong SAR, ChinaHungaryIBRD onlyIcelandIDA & IBRD totalIDA blendIDA onlyIDA totalIndiaIndonesiaIran, Islamic Rep.IraqIrelandIsraelItalyJamaicaJapanJordanKazakhstanKenyaKiribatiKorea, Dem. People’s Rep.Korea, Rep.KuwaitKyrgyz RepublicLao PDRLate-demographic dividendLatin America & Caribbean Latin America & Caribbean (excluding high income)Latin America & the Caribbean (IDA & IBRD countries)LatviaLeast developed countries: UN classificationLebanonLesothoLiberiaLibyaLiechtensteinLithuaniaLow & middle incomeLow incomeLower middle incomeLuxembourgMacao SAR, ChinaMacedonia, FYRMadagascarMalawiMaldivesMaliMaltaMarshall IslandsMauritaniaMauritiusMexicoMicronesia, Fed. Sts.Middle East & North AfricaMiddle East & North Africa (excluding high income)Middle East & North Africa (IDA & IBRD countries)Middle incomeMoldovaMongoliaMontenegroMoroccoMozambiqueMyanmarNamibiaNauruNepalNetherlandsNew ZealandNicaraguaNigerNigeriaNorth AmericaNorwayOECD membersOmanOther small statesPacific island small statesPakistanPalauPanamaPapua New GuineaParaguayPeruPhilippinesPolandPortugalPost-demographic dividendPre-demographic dividendPuerto RicoQatarRomaniaRussian FederationRwandaSamoaSan MarinoSao Tome and PrincipeSaudi ArabiaSenegalSerbiaSeychellesSierra LeoneSlovak RepublicSloveniaSmall statesSolomon IslandsSouth AfricaSouth AsiaSouth Asia (IDA & IBRD)South SudanSpainSri LankaSt. Kitts and NevisSt. LuciaSt. Vincent and the GrenadinesSub-Saharan Africa Sub-Saharan Africa (excluding high income)Sub-Saharan Africa (IDA & IBRD countries)SudanSurinameSwazilandSwedenSwitzerlandSyrian Arab RepublicTajikistanTanzaniaThailandTimor-LesteTogoTongaTrinidad and TobagoTunisiaTurkeyTuvaluUgandaUkraineUnited Arab EmiratesUnited StatesUpper middle incomeUruguayUzbekistanVanuatuVenezuela, RBVietnamWest Bank and GazaWorldYemen, Rep.ZambiaZimbabwe Timeline:
This timeline shows a graph from 1985 to 2015 of Upper middle income. No data until 1984. Number of actual observations by date: 31.
Source name:
World Development Indicators
Source organization:
UNESCO Institute for Statistics
Categories, topics:
Education, Gender
Last updated:
apr 23, 2017
Indicators value changes by year
Minimum:
98.658
jan 1, 2001
Maximum:
125.159
jan 1, 1985
At the date of observation
Value
Absolute change
Change from previous value
jan 1, 1985
125.159
+125.159
0.0%
jan 1, 1986
125.143
-0.015
-0.01%
jan 1, 1987
122.684
-2.46
-1.97%
jan 1, 1988
123.386
+0.702
0.57%
jan 1, 1989
121.197
-2.189
-1.77%
jan 1, 1990
117.145
-4.052
-3.34%
jan 1, 1991
119.343
+2.198
1.88%
jan 1, 1992
110.78
-8.563
-7.18%
jan 1, 1993
108.411
-2.369
-2.14%
jan 1, 1994
107.671
-0.74
-0.68%
jan 1, 1995
106.99
-0.681
-0.63%
jan 1, 1996
105.983
-1.007
-0.94%
jan 1, 1997
101.782
-4.201
-3.96%
jan 1, 1998
100.298
-1.484
-1.46%
jan 1, 1999
100.157
-0.141
-0.14%
jan 1, 2000
98.777
-1.38
-1.38%
jan 1, 2001
98.658
-0.12
-0.12%
jan 1, 2002
99.309
+0.651
0.66%
jan 1, 2003
103.568
+4.259
4.29%
jan 1, 2004
106.771
+3.203
3.09%
jan 1, 2005
108.647
+1.876
1.76%
jan 1, 2006
111.341
+2.694
2.48%
jan 1, 2007
108.967
-2.374
-2.13%
jan 1, 2008
112.024
+3.057
2.81%
jan 1, 2009
112.386
+0.362
0.32%
jan 1, 2010
109.289
-3.097
-2.76%
jan 1, 2011
106.9
-2.388
-2.19%
jan 1, 2012
107.695
+0.795
0.74%
jan 1, 2013
107.434
-0.261
-0.24%
jan 1, 2014
108.071
+0.637
0.59%
jan 1, 2015
106.003
-2.069
-1.91%
Ranking of countries by current statistics by years


Comments: