29
/
en
AIzaSyAYiBZKx7MnpbEhh9jyipgxe19OcubqV5w
April 1, 2024
202989
Mozambique
MOZ
true
2
1
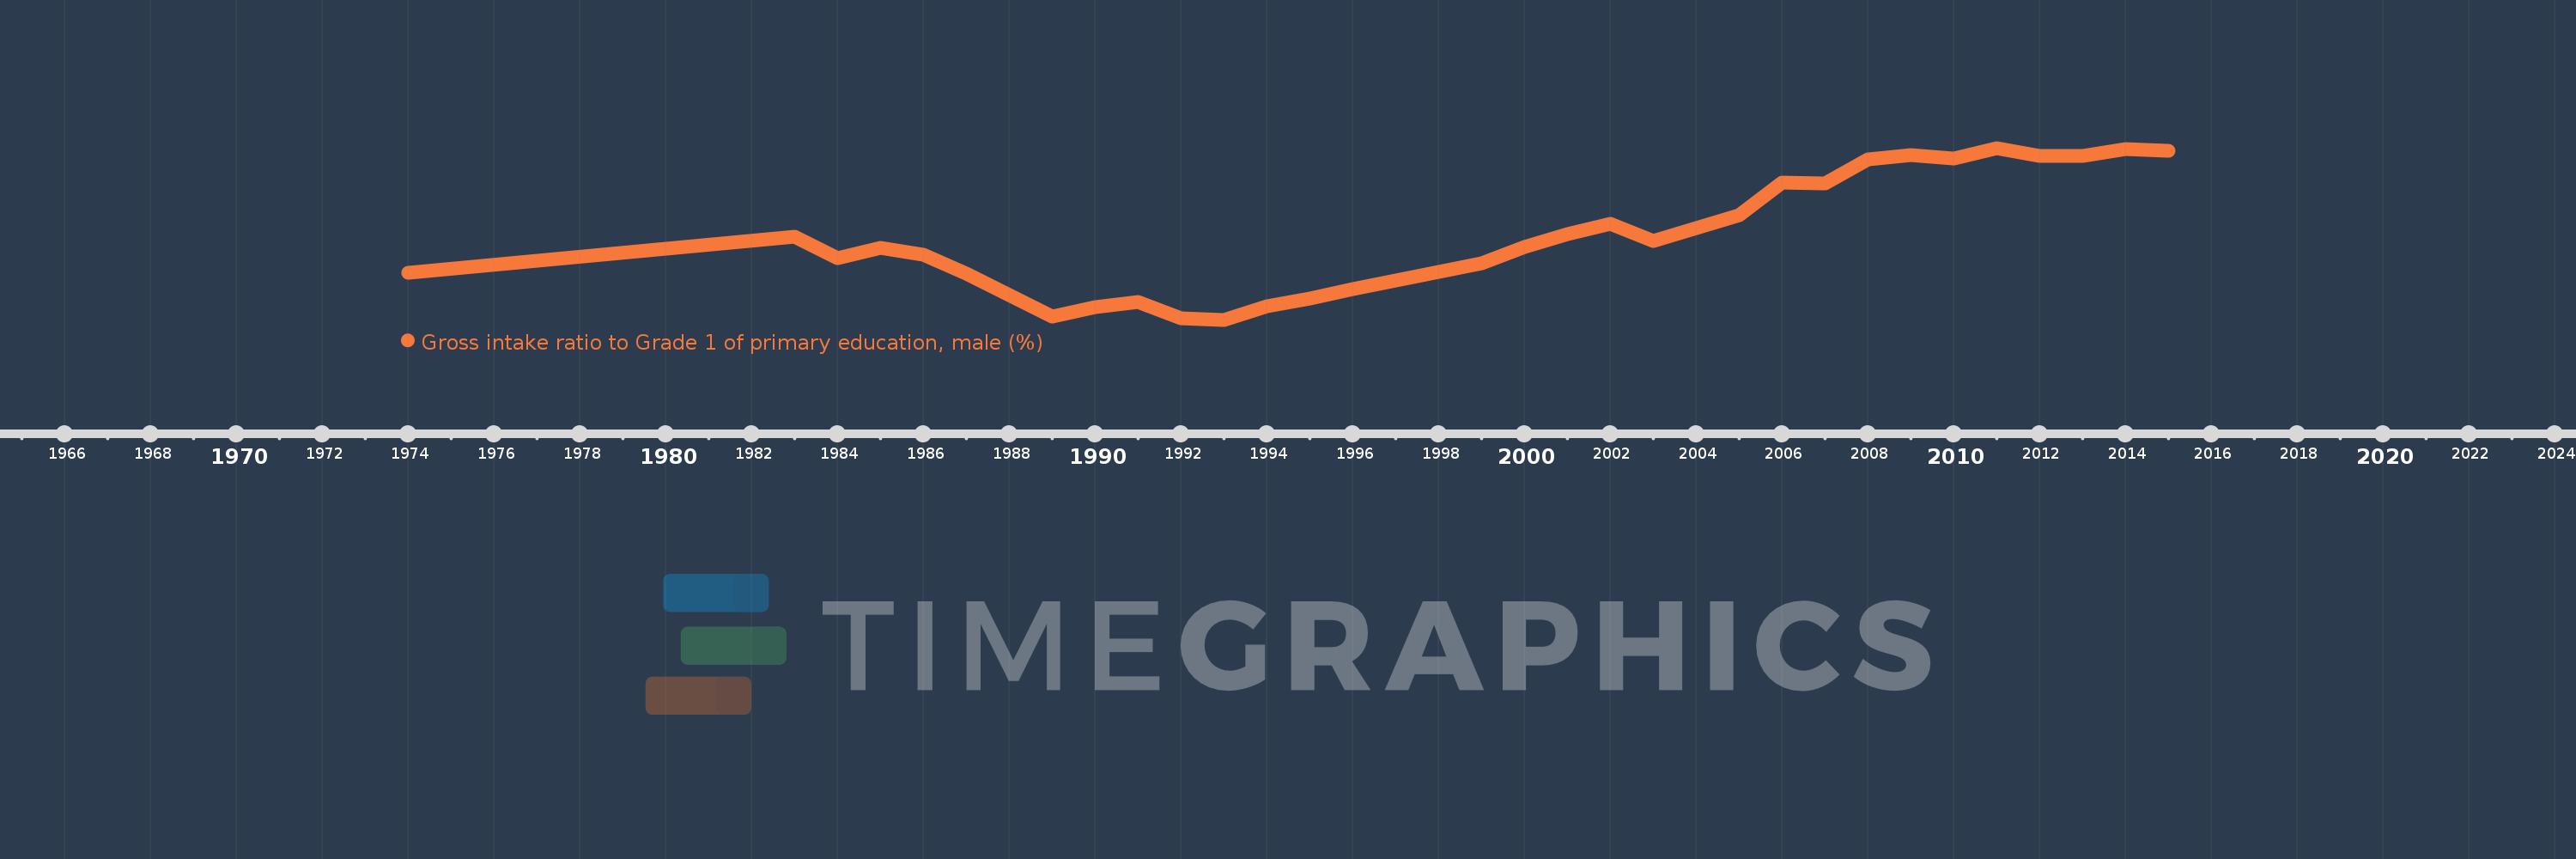
Gross intake ratio to Grade 1 of primary education, male (%)
2015,2014,2013,2012,2011,2010,2009,2008,2007,2006,2005,2003,2002,2001,2000,1999,1996,1995,1994,1993,1992,1991,1990,1989,1988,1987,1986,1985,1984,1983,1974
This statistics in other country:
AfghanistanAlbaniaAlgeriaAngolaAntigua and BarbudaArab WorldArgentinaArmeniaArubaAustriaAzerbaijanBahamas, TheBahrainBangladeshBarbadosBelarusBelgiumBelizeBeninBermudaBhutanBoliviaBosnia and HerzegovinaBotswanaBrazilBrunei DarussalamBulgariaBurkina FasoBurundiCabo VerdeCambodiaCameroonCanadaCaribbean small statesCentral African RepublicCentral Europe and the BalticsChadChileChinaColombiaComorosCongo, Dem. Rep.Congo, Rep.Costa RicaCote d'IvoireCroatiaCubaCyprusCzech RepublicDenmarkDjiboutiDominicaDominican RepublicEarly-demographic dividendEast Asia & PacificEast Asia & Pacific (excluding high income)East Asia & Pacific (IDA & IBRD countries)EcuadorEgypt, Arab Rep.El SalvadorEquatorial GuineaEritreaEstoniaEthiopiaEuro areaEurope & Central AsiaEurope & Central Asia (excluding high income)Europe & Central Asia (IDA & IBRD countries)European UnionFijiFinlandFragile and conflict affected situationsFranceGabonGambia, TheGeorgiaGermanyGhanaGreeceGrenadaGuatemalaGuineaGuinea-BissauGuyanaHaitiHeavily indebted poor countries (HIPC)High incomeHondurasHong Kong SAR, ChinaHungaryIBRD onlyIcelandIDA & IBRD totalIDA blendIDA onlyIDA totalIndiaIndonesiaIran, Islamic Rep.IraqIrelandIsraelItalyJamaicaJapanJordanKazakhstanKenyaKiribatiKorea, Dem. People’s Rep.Korea, Rep.KuwaitKyrgyz RepublicLao PDRLate-demographic dividendLatin America & Caribbean Latin America & Caribbean (excluding high income)Latin America & the Caribbean (IDA & IBRD countries)LatviaLeast developed countries: UN classificationLebanonLesothoLiberiaLibyaLiechtensteinLithuaniaLow & middle incomeLow incomeLower middle incomeLuxembourgMacao SAR, ChinaMacedonia, FYRMadagascarMalawiMaldivesMaliMaltaMarshall IslandsMauritaniaMauritiusMexicoMicronesia, Fed. Sts.Middle East & North AfricaMiddle East & North Africa (excluding high income)Middle East & North Africa (IDA & IBRD countries)Middle incomeMoldovaMongoliaMontenegroMoroccoMozambiqueMyanmarNamibiaNauruNepalNetherlandsNew ZealandNicaraguaNigerNigeriaNorth AmericaNorwayOECD membersOmanOther small statesPacific island small statesPakistanPalauPanamaPapua New GuineaParaguayPeruPhilippinesPolandPortugalPost-demographic dividendPre-demographic dividendPuerto RicoQatarRomaniaRussian FederationRwandaSamoaSan MarinoSao Tome and PrincipeSaudi ArabiaSenegalSerbiaSeychellesSierra LeoneSlovak RepublicSloveniaSmall statesSolomon IslandsSouth AfricaSouth AsiaSouth Asia (IDA & IBRD)South SudanSpainSri LankaSt. Kitts and NevisSt. LuciaSt. Vincent and the GrenadinesSub-Saharan Africa Sub-Saharan Africa (excluding high income)Sub-Saharan Africa (IDA & IBRD countries)SudanSurinameSwazilandSwedenSwitzerlandSyrian Arab RepublicTajikistanTanzaniaThailandTimor-LesteTogoTongaTrinidad and TobagoTunisiaTurkeyTuvaluUgandaUkraineUnited Arab EmiratesUnited StatesUpper middle incomeUruguayUzbekistanVanuatuVenezuela, RBVietnamWest Bank and GazaWorldYemen, Rep.ZambiaZimbabwe Timeline:
This timeline shows a graph from 1974 to 2015 of Mozambique. No data until 1973. Number of actual observations by date: 31.
Source name:
World Development Indicators
Source organization:
UNESCO Institute for Statistics
Categories, topics:
Education, Gender
Last updated:
apr 23, 2017
Indicators value changes by year
Minimum:
69.994
jan 1, 1993
Maximum:
160.096
jan 1, 2011
At the date of observation
Value
Absolute change
Change from previous value
jan 1, 1974
94.441
+94.441
0.0%
jan 1, 1983
113.61
+19.169
20.3%
jan 1, 1984
102.271
-11.339
-9.98%
jan 1, 1985
107.749
+5.478
5.36%
jan 1, 1986
103.906
-3.843
-3.57%
jan 1, 1987
94.165
-9.741
-9.37%
jan 1, 1988
82.741
-11.424
-12.13%
jan 1, 1989
71.552
-11.189
-13.52%
jan 1, 1990
76.784
+5.233
7.31%
jan 1, 1991
79.324
+2.54
3.31%
jan 1, 1992
70.561
-8.763
-11.05%
jan 1, 1993
69.994
-0.567
-0.8%
jan 1, 1994
77.171
+7.177
10.25%
jan 1, 1995
81.155
+3.984
5.16%
jan 1, 1996
86.278
+5.123
6.31%
jan 1, 1999
99.767
+13.489
15.63%
jan 1, 2000
108.304
+8.537
8.56%
jan 1, 2001
114.981
+6.677
6.17%
jan 1, 2002
120.314
+5.333
4.64%
jan 1, 2003
111.191
-9.123
-7.58%
jan 1, 2005
124.956
+13.766
12.38%
jan 1, 2006
141.877
+16.921
13.54%
jan 1, 2007
141.342
-0.535
-0.38%
jan 1, 2008
154.119
+12.777
9.04%
jan 1, 2009
156.25
+2.131
1.38%
jan 1, 2010
154.532
-1.718
-1.1%
jan 1, 2011
160.096
+5.564
3.6%
jan 1, 2012
155.888
-4.208
-2.63%
jan 1, 2013
155.775
-0.113
-0.07%
jan 1, 2014
159.314
+3.539
2.27%
jan 1, 2015
158.412
-0.902
-0.57%
Ranking of countries by current statistics by years


Comments: