29
/
en
AIzaSyAYiBZKx7MnpbEhh9jyipgxe19OcubqV5w
April 1, 2024
186578
Malawi
MWI
true
2
1
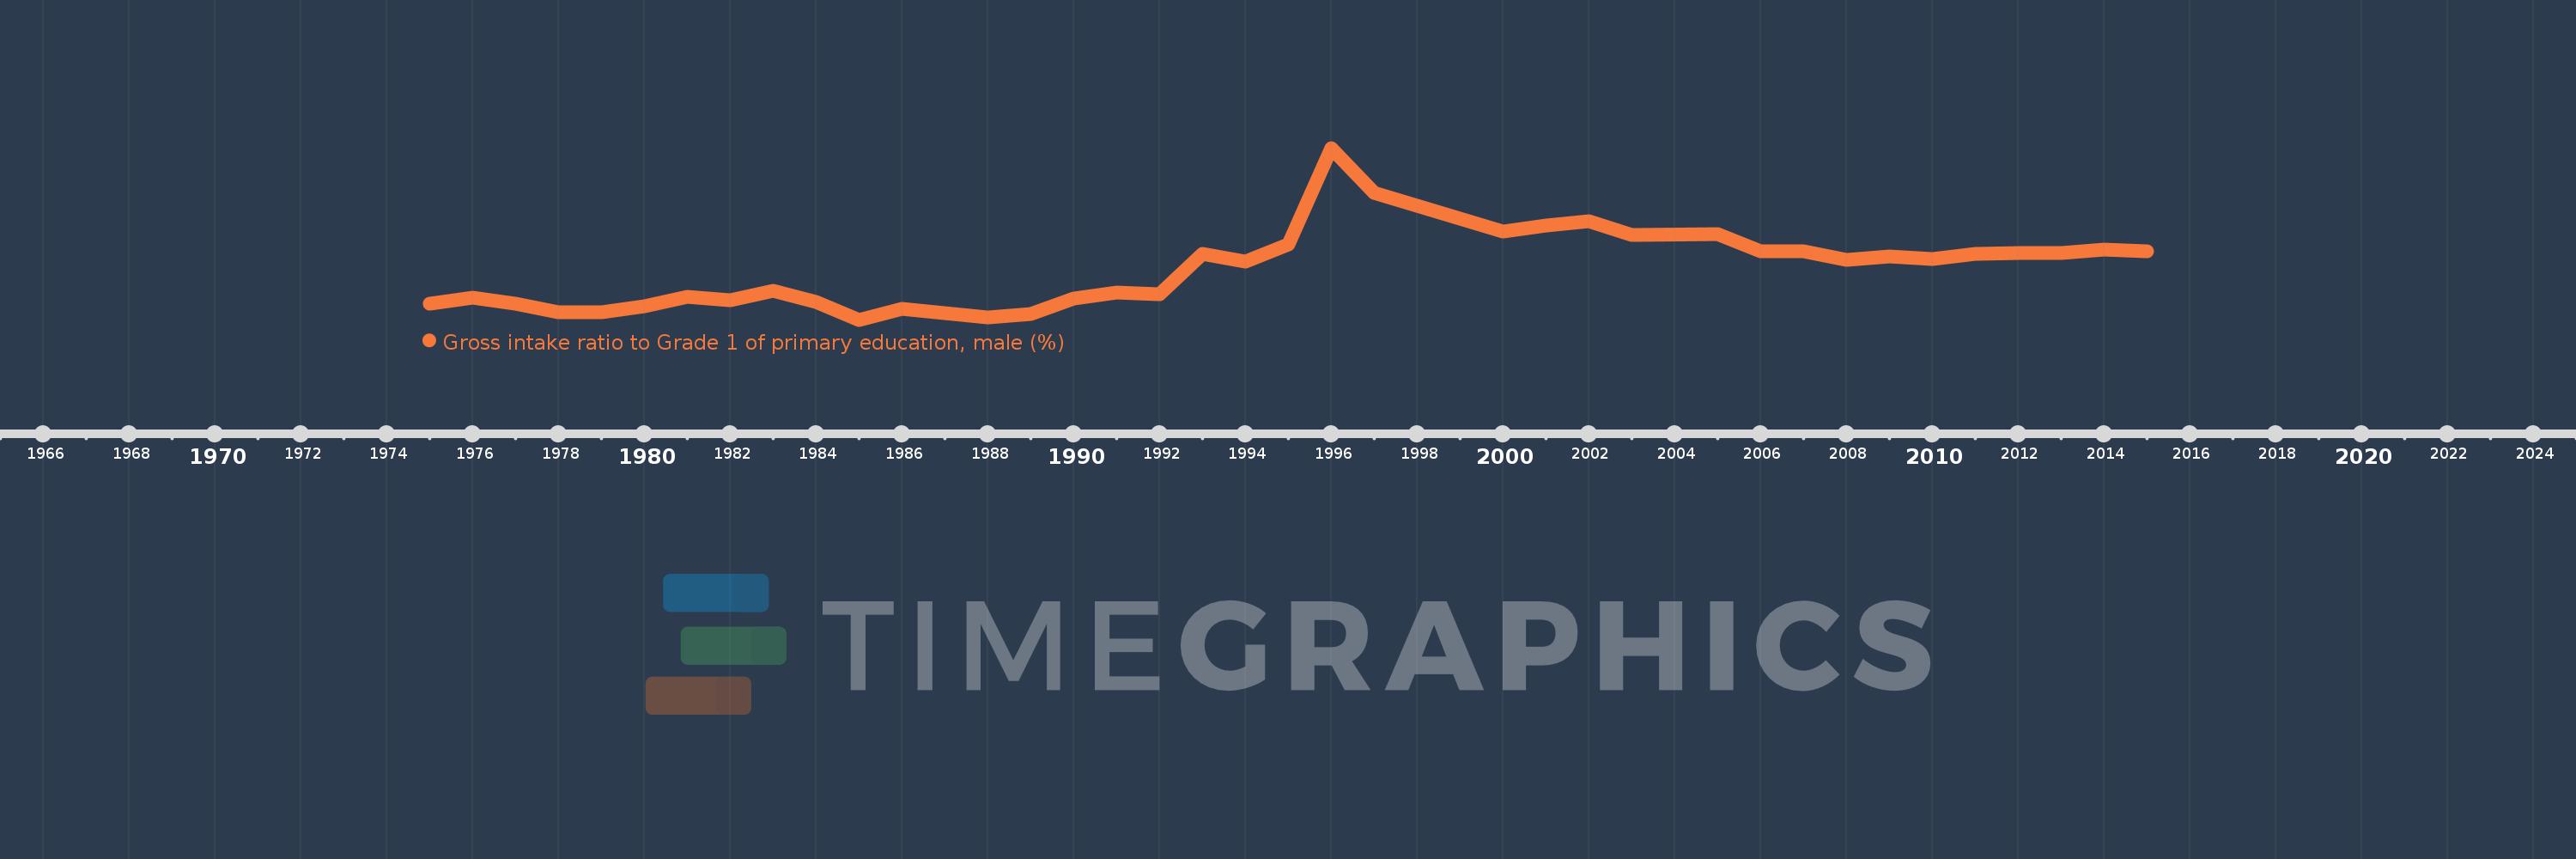
Gross intake ratio to Grade 1 of primary education, male (%)
2015,2014,2013,2012,2011,2010,2009,2008,2007,2006,2005,2003,2002,2001,2000,1997,1996,1995,1994,1993,1992,1991,1990,1989,1988,1987,1986,1985,1984,1983,1982,1981,1980,1979,1978,1977,1976,1975
This statistics in other country:
AfghanistanAlbaniaAlgeriaAngolaAntigua and BarbudaArab WorldArgentinaArmeniaArubaAustriaAzerbaijanBahamas, TheBahrainBangladeshBarbadosBelarusBelgiumBelizeBeninBermudaBhutanBoliviaBosnia and HerzegovinaBotswanaBrazilBrunei DarussalamBulgariaBurkina FasoBurundiCabo VerdeCambodiaCameroonCanadaCaribbean small statesCentral African RepublicCentral Europe and the BalticsChadChileChinaColombiaComorosCongo, Dem. Rep.Congo, Rep.Costa RicaCote d'IvoireCroatiaCubaCyprusCzech RepublicDenmarkDjiboutiDominicaDominican RepublicEarly-demographic dividendEast Asia & PacificEast Asia & Pacific (excluding high income)East Asia & Pacific (IDA & IBRD countries)EcuadorEgypt, Arab Rep.El SalvadorEquatorial GuineaEritreaEstoniaEthiopiaEuro areaEurope & Central AsiaEurope & Central Asia (excluding high income)Europe & Central Asia (IDA & IBRD countries)European UnionFijiFinlandFragile and conflict affected situationsFranceGabonGambia, TheGeorgiaGermanyGhanaGreeceGrenadaGuatemalaGuineaGuinea-BissauGuyanaHaitiHeavily indebted poor countries (HIPC)High incomeHondurasHong Kong SAR, ChinaHungaryIBRD onlyIcelandIDA & IBRD totalIDA blendIDA onlyIDA totalIndiaIndonesiaIran, Islamic Rep.IraqIrelandIsraelItalyJamaicaJapanJordanKazakhstanKenyaKiribatiKorea, Dem. People’s Rep.Korea, Rep.KuwaitKyrgyz RepublicLao PDRLate-demographic dividendLatin America & Caribbean Latin America & Caribbean (excluding high income)Latin America & the Caribbean (IDA & IBRD countries)LatviaLeast developed countries: UN classificationLebanonLesothoLiberiaLibyaLiechtensteinLithuaniaLow & middle incomeLow incomeLower middle incomeLuxembourgMacao SAR, ChinaMacedonia, FYRMadagascarMalawiMaldivesMaliMaltaMarshall IslandsMauritaniaMauritiusMexicoMicronesia, Fed. Sts.Middle East & North AfricaMiddle East & North Africa (excluding high income)Middle East & North Africa (IDA & IBRD countries)Middle incomeMoldovaMongoliaMontenegroMoroccoMozambiqueMyanmarNamibiaNauruNepalNetherlandsNew ZealandNicaraguaNigerNigeriaNorth AmericaNorwayOECD membersOmanOther small statesPacific island small statesPakistanPalauPanamaPapua New GuineaParaguayPeruPhilippinesPolandPortugalPost-demographic dividendPre-demographic dividendPuerto RicoQatarRomaniaRussian FederationRwandaSamoaSan MarinoSao Tome and PrincipeSaudi ArabiaSenegalSerbiaSeychellesSierra LeoneSlovak RepublicSloveniaSmall statesSolomon IslandsSouth AfricaSouth AsiaSouth Asia (IDA & IBRD)South SudanSpainSri LankaSt. Kitts and NevisSt. LuciaSt. Vincent and the GrenadinesSub-Saharan Africa Sub-Saharan Africa (excluding high income)Sub-Saharan Africa (IDA & IBRD countries)SudanSurinameSwazilandSwedenSwitzerlandSyrian Arab RepublicTajikistanTanzaniaThailandTimor-LesteTogoTongaTrinidad and TobagoTunisiaTurkeyTuvaluUgandaUkraineUnited Arab EmiratesUnited StatesUpper middle incomeUruguayUzbekistanVanuatuVenezuela, RBVietnamWest Bank and GazaWorldYemen, Rep.ZambiaZimbabwe Timeline:
This timeline shows a graph from 1975 to 2015 of Malawi. No data until 1974. Number of actual observations by date: 38.
Source name:
World Development Indicators
Source organization:
UNESCO Institute for Statistics
Categories, topics:
Education, Gender
Last updated:
apr 23, 2017
Indicators value changes by year
Minimum:
80.612
jan 1, 1985
Maximum:
268.926
jan 1, 1996
At the date of observation
Value
Absolute change
Change from previous value
jan 1, 1975
98.642
+98.642
0.0%
jan 1, 1976
105.208
+6.566
6.66%
jan 1, 1977
97.893
-7.315
-6.95%
jan 1, 1978
88.71
-9.182
-9.38%
jan 1, 1979
88.411
-0.299
-0.34%
jan 1, 1980
95.814
+7.403
8.37%
jan 1, 1981
106.033
+10.219
10.67%
jan 1, 1982
101.538
-4.496
-4.24%
jan 1, 1983
112.721
+11.183
11.01%
jan 1, 1984
100.154
-12.567
-11.15%
jan 1, 1985
80.612
-19.542
-19.51%
jan 1, 1986
92.87
+12.258
15.21%
jan 1, 1987
87.812
-5.058
-5.45%
jan 1, 1988
83.011
-4.801
-5.47%
jan 1, 1989
87.018
+4.007
4.83%
jan 1, 1990
103.828
+16.81
19.32%
jan 1, 1991
110.273
+6.444
6.21%
jan 1, 1992
108.308
-1.964
-1.78%
jan 1, 1993
152.711
+44.402
41.0%
jan 1, 1994
144.504
-8.207
-5.37%
jan 1, 1995
163.282
+18.778
12.99%
jan 1, 1996
268.926
+105.643
64.7%
jan 1, 1997
220.065
-48.861
-18.17%
jan 1, 2000
177.111
-42.954
-19.52%
jan 1, 2001
183.602
+6.491
3.67%
jan 1, 2002
188.309
+4.706
2.56%
jan 1, 2003
173.296
-15.013
-7.97%
jan 1, 2005
174.166
+0.87
0.5%
jan 1, 2006
155.212
-18.954
-10.88%
jan 1, 2007
155.329
+0.117
0.08%
jan 1, 2008
146.186
-9.143
-5.89%
jan 1, 2009
149.711
+3.525
2.41%
jan 1, 2010
147.008
-2.703
-1.81%
jan 1, 2011
152.713
+5.706
3.88%
jan 1, 2012
153.69
+0.977
0.64%
jan 1, 2013
153.751
+0.061
0.04%
jan 1, 2014
157.886
+4.134
2.69%
jan 1, 2015
155.352
-2.534
-1.61%
Ranking of countries by current statistics by years


Comments: