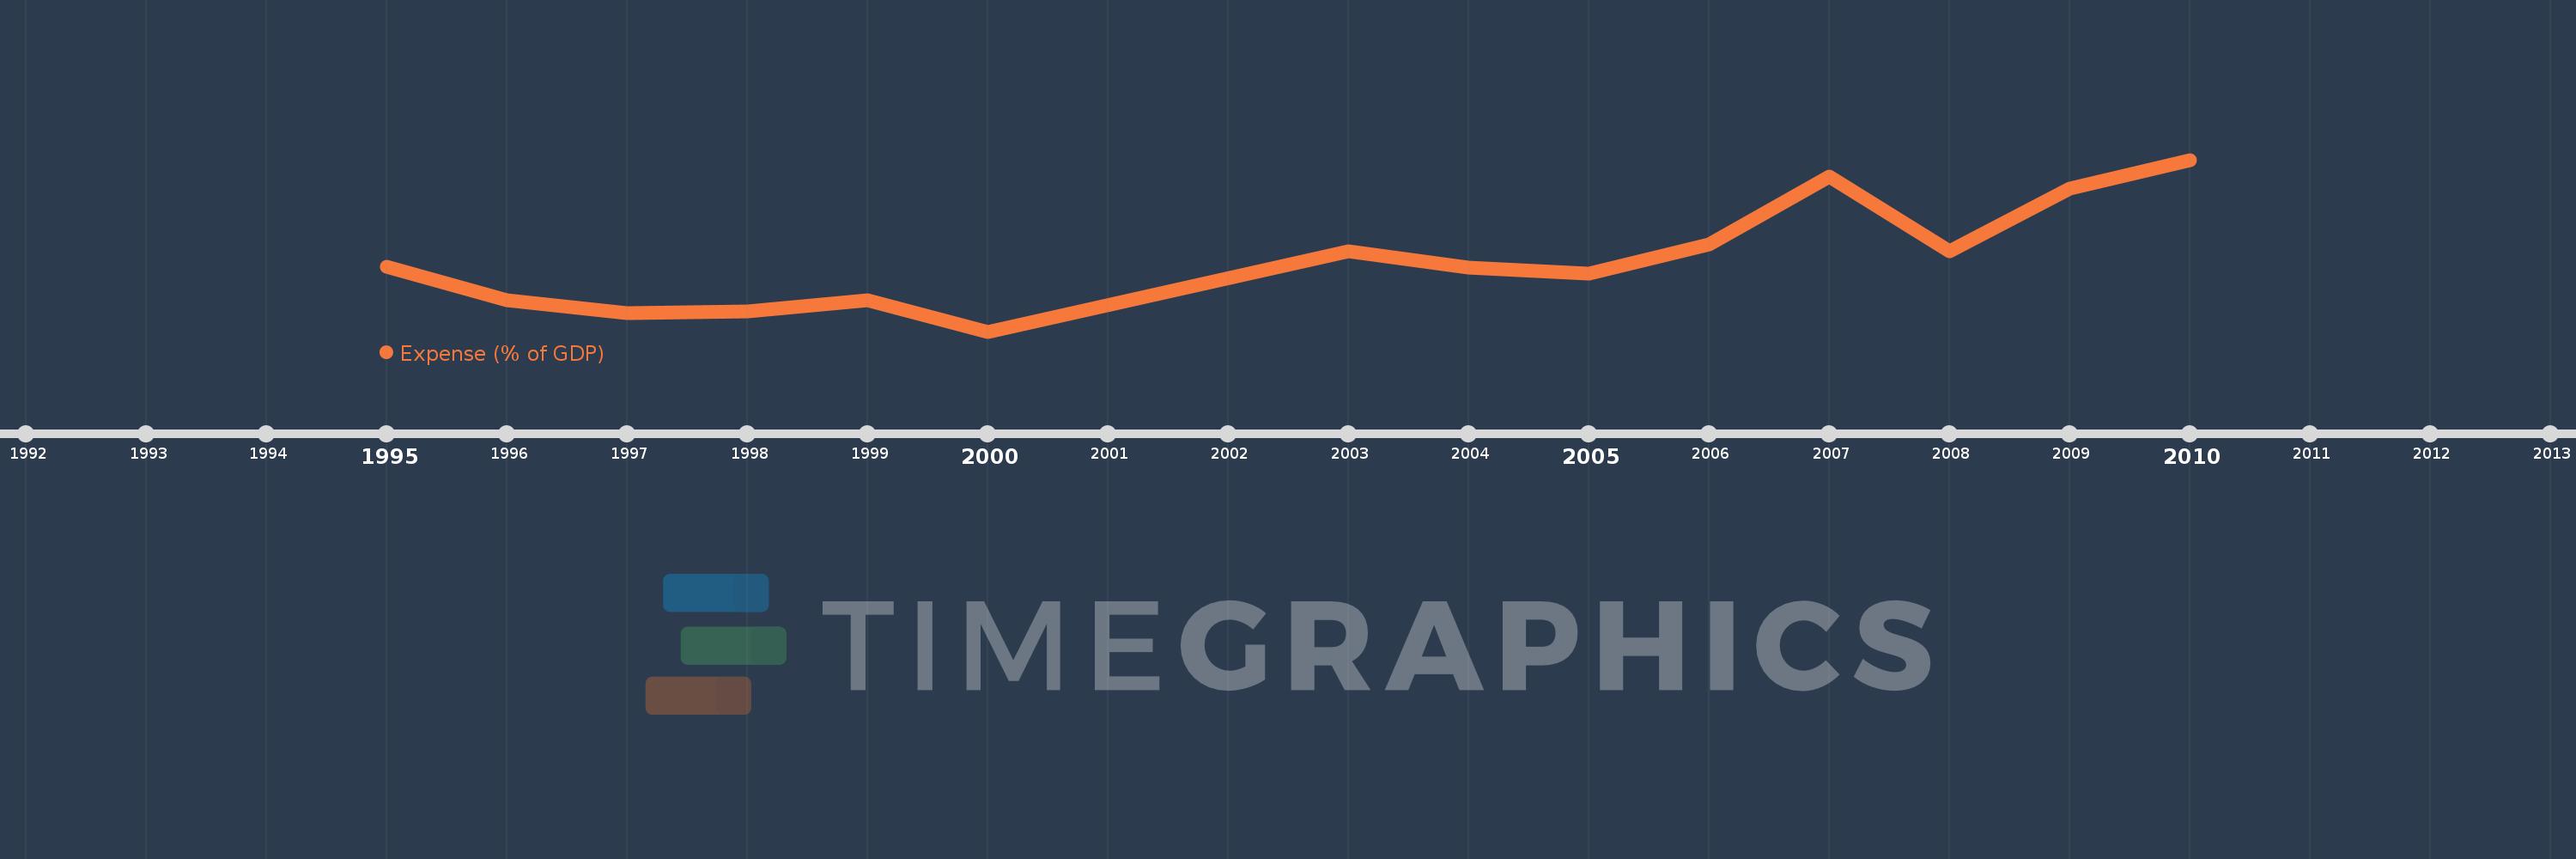
This timeline shows a graph from 1995 to 2010 of Middle East & North Africa (excluding high income). No data until 1994. Number of actual observations by date: 14.
Source name:
World Development Indicators
Source organization:
International Monetary Fund, Government Finance Statistics Yearbook and data files, and World Bank and OECD GDP estimates.
Categories, topics:
Economy & Growth, Public Sector
Last updated:
apr 23, 2017
Indicators value changes by year
Meaning:
21.948
Minimum:
20.046
jan 1, 2000
Maximum:
24.595
jan 1, 2010
At the date of observation
Value
Absolute change
Change from the previous value
jan 1, 1995
21.756
+21.756
0.0%
jan 1, 1996
20.871
-0.884
-4.07%
jan 1, 1997
20.529
-0.343
-1.64%
jan 1, 1998
20.572
+0.043
0.21%
jan 1, 1999
20.869
+0.297
1.44%
jan 1, 2000
20.046
-0.823
-3.94%
jan 1, 2003
22.171
+2.126
10.6%
jan 1, 2004
21.748
-0.423
-1.91%
jan 1, 2005
21.591
-0.157
-0.72%
jan 1, 2006
22.365
+0.774
3.58%
jan 1, 2007
24.148
+1.783
7.97%
jan 1, 2008
22.176
-1.972
-8.17%
jan 1, 2009
23.841
+1.665
7.51%
jan 1, 2010
24.595
+0.754
3.16%
Ranking of countries by current statistics by years
