29
/
en
AIzaSyAYiBZKx7MnpbEhh9jyipgxe19OcubqV5w
April 1, 2024
169842
Korea, Rep.
KOR
true
2
1
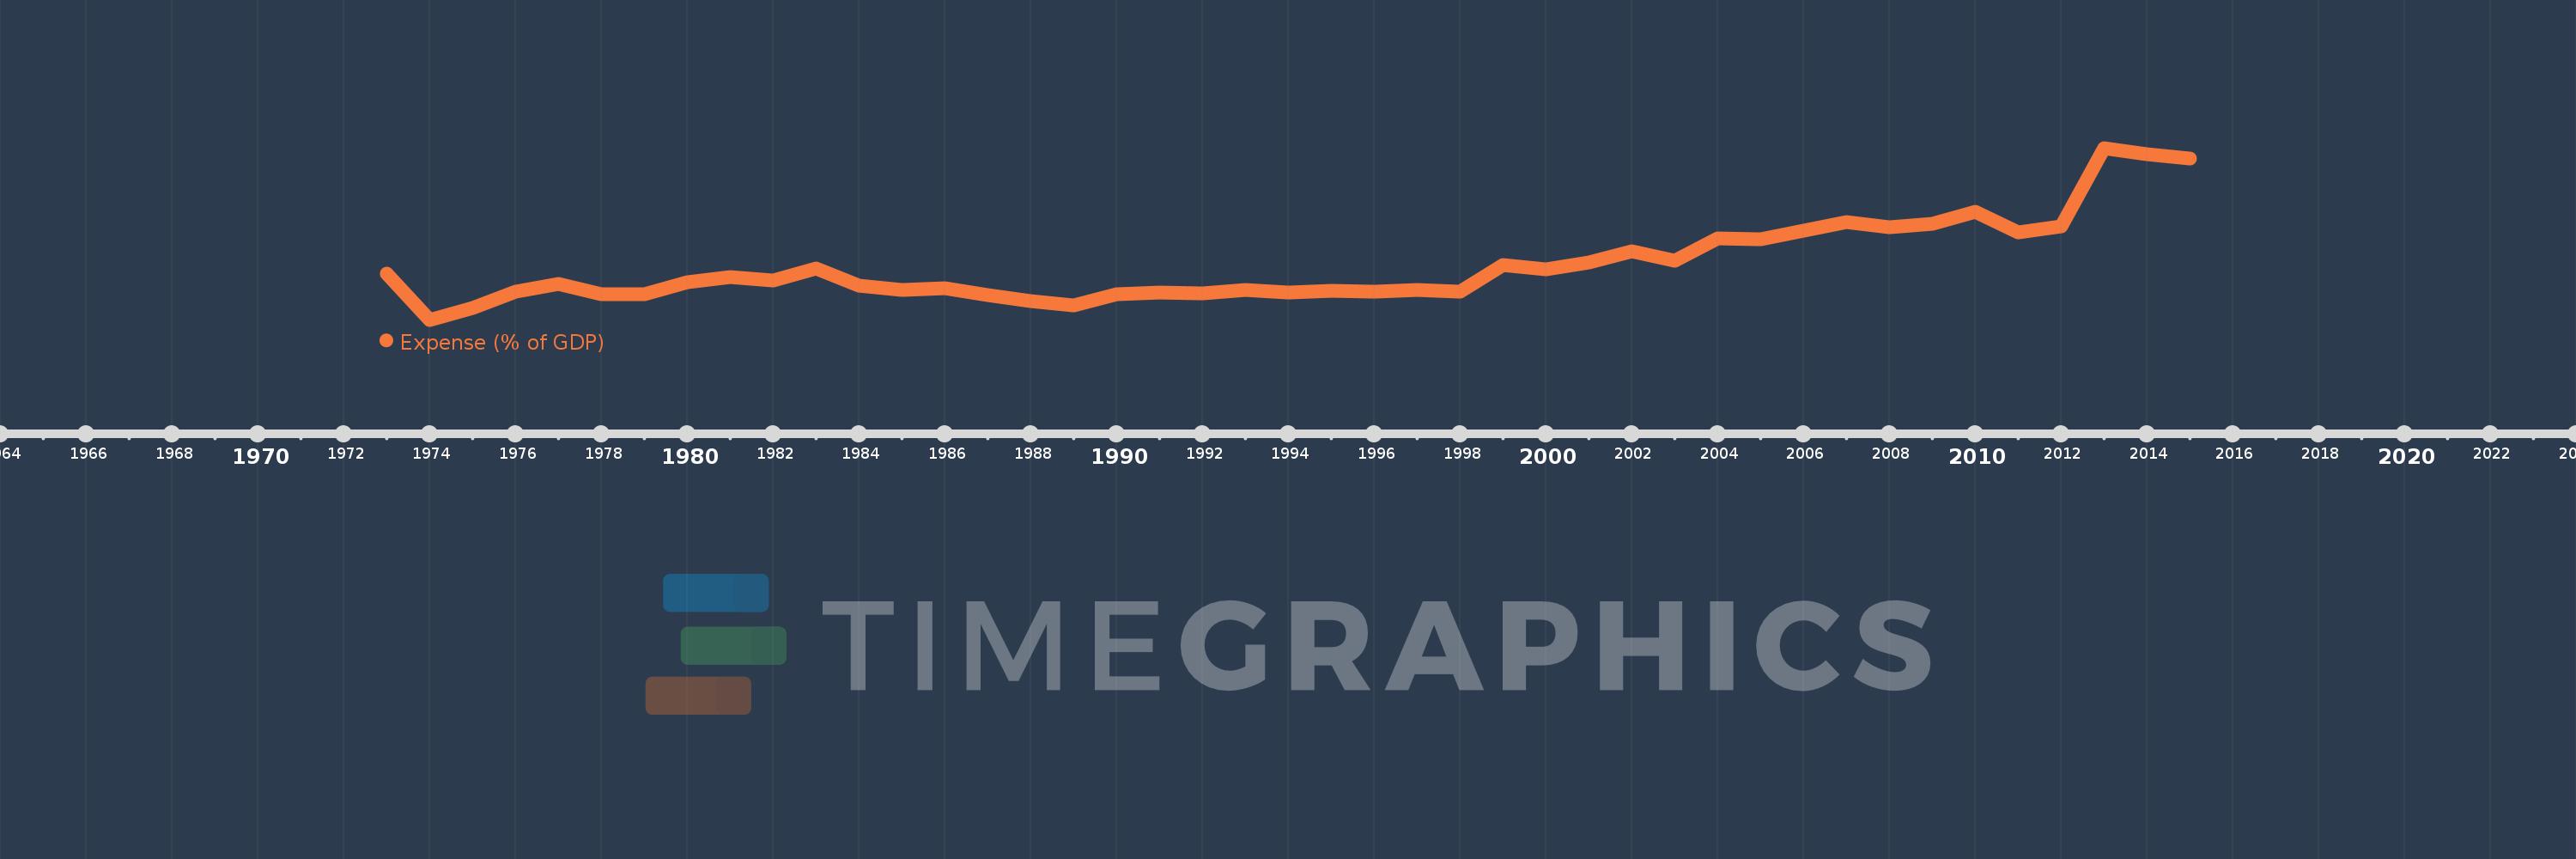
Expense (% of GDP)
2015,2014,2013,2012,2011,2010,2009,2008,2007,2006,2005,2004,2003,2002,2001,2000,1999,1998,1997,1996,1995,1994,1993,1992,1991,1990,1989,1988,1987,1986,1985,1984,1983,1982,1981,1980,1979,1978,1977,1976,1975,1974,1973
This statistics in other country:
AfghanistanAlbaniaAlgeriaAngolaAntigua and BarbudaArmeniaAustraliaAustriaAzerbaijanBahamas, TheBahrainBangladeshBarbadosBelarusBelgiumBelizeBeninBhutanBoliviaBosnia and HerzegovinaBotswanaBrazilBulgariaBurkina FasoBurundiCabo VerdeCambodiaCanadaCaribbean small statesCentral African RepublicCentral Europe and the BalticsChileColombiaCongo, Dem. Rep.Congo, Rep.Costa RicaCote d'IvoireCroatiaCyprusCzech RepublicDenmarkDominicaDominican RepublicEarly-demographic dividendEgypt, Arab Rep.El SalvadorEquatorial GuineaEstoniaEthiopiaEuro areaEurope & Central AsiaEurope & Central Asia (excluding high income)Europe & Central Asia (IDA & IBRD countries)European UnionFijiFinlandFranceGambia, TheGeorgiaGermanyGhanaGreeceGrenadaGuatemalaHeavily indebted poor countries (HIPC)High incomeHondurasHong Kong SAR, ChinaHungaryIcelandIDA blendIDA onlyIDA totalIndiaIndonesiaIran, Islamic Rep.IraqIrelandIsraelItalyJamaicaJapanJordanKazakhstanKenyaKiribatiKorea, Rep.KuwaitKyrgyz RepublicLao PDRLatin America & Caribbean Latin America & Caribbean (excluding high income)Latin America & the Caribbean (IDA & IBRD countries)LatviaLeast developed countries: UN classificationLebanonLesothoLiberiaLithuaniaLow incomeLower middle incomeLuxembourgMacao SAR, ChinaMacedonia, FYRMadagascarMalawiMalaysiaMaldivesMaliMaltaMauritiusMexicoMicronesia, Fed. Sts.Middle East & North Africa (excluding high income)Middle East & North Africa (IDA & IBRD countries)MoldovaMongoliaMoroccoMozambiqueMyanmarNamibiaNepalNetherlandsNew ZealandNicaraguaNigeriaNorth AmericaNorwayOECD membersOmanOther small statesPacific island small statesPakistanPanamaPapua New GuineaParaguayPeruPhilippinesPolandPortugalPost-demographic dividendPre-demographic dividendQatarRomaniaRussian FederationRwandaSamoaSan MarinoSao Tome and PrincipeSenegalSerbiaSeychellesSierra LeoneSingaporeSlovak RepublicSloveniaSmall statesSolomon IslandsSouth AfricaSouth AsiaSouth Asia (IDA & IBRD)SpainSri LankaSt. Kitts and NevisSt. LuciaSub-Saharan Africa Sub-Saharan Africa (excluding high income)Sub-Saharan Africa (IDA & IBRD countries)SurinameSwazilandSwedenSwitzerlandSyrian Arab RepublicTajikistanTanzaniaThailandTimor-LesteTogoTrinidad and TobagoTunisiaTurkeyUgandaUkraineUnited Arab EmiratesUnited KingdomUnited StatesUruguayVanuatuVenezuela, RBVietnamWest Bank and GazaWorldYemen, Rep.ZambiaZimbabwe Timeline:
This timeline shows a graph from 1973 to 2015 of Korea, Rep.. No data until 1972. Number of actual observations by date: 43.
Source name:
World Development Indicators
Source organization:
International Monetary Fund, Government Finance Statistics Yearbook and data files, and World Bank and OECD GDP estimates.
Categories, topics:
Economy & Growth, Public Sector
Last updated:
apr 23, 2017
Indicators value changes by year
Minimum:
10.793
jan 1, 1974
Maximum:
25.754
jan 1, 2013
At the date of observation
Value
Absolute change
Change from previous value
jan 1, 1973
14.8
+14.8
0.0%
jan 1, 1974
10.793
-4.007
-27.08%
jan 1, 1975
11.825
+1.033
9.57%
jan 1, 1976
13.223
+1.397
11.82%
jan 1, 1977
13.891
+0.668
5.05%
jan 1, 1978
13.011
-0.88
-6.33%
jan 1, 1979
13.023
+0.012
0.1%
jan 1, 1980
14.065
+1.042
8.0%
jan 1, 1981
14.479
+0.413
2.94%
jan 1, 1982
14.235
-0.244
-1.68%
jan 1, 1983
15.275
+1.041
7.31%
jan 1, 1984
13.735
-1.541
-10.09%
jan 1, 1985
13.361
-0.374
-2.72%
jan 1, 1986
13.566
+0.205
1.53%
jan 1, 1987
12.918
-0.648
-4.78%
jan 1, 1988
12.402
-0.516
-3.99%
jan 1, 1989
12.055
-0.347
-2.79%
jan 1, 1990
13.012
+0.957
7.93%
jan 1, 1991
13.195
+0.183
1.41%
jan 1, 1992
13.114
-0.081
-0.61%
jan 1, 1993
13.397
+0.283
2.16%
jan 1, 1994
13.142
-0.255
-1.9%
jan 1, 1995
13.329
+0.187
1.42%
jan 1, 1996
13.22
-0.109
-0.82%
jan 1, 1997
13.398
+0.178
1.35%
jan 1, 1998
13.267
-0.132
-0.98%
jan 1, 1999
15.552
+2.285
17.23%
jan 1, 2000
15.188
-0.365
-2.34%
jan 1, 2001
15.79
+0.602
3.96%
jan 1, 2002
16.778
+0.989
6.26%
jan 1, 2003
15.902
-0.877
-5.22%
jan 1, 2004
17.865
+1.964
12.35%
jan 1, 2005
17.804
-0.061
-0.34%
jan 1, 2006
18.549
+0.745
4.18%
jan 1, 2007
19.311
+0.762
4.11%
jan 1, 2008
18.823
-0.489
-2.53%
jan 1, 2009
19.142
+0.319
1.7%
jan 1, 2010
20.201
+1.059
5.53%
jan 1, 2011
18.425
-1.776
-8.79%
jan 1, 2012
18.901
+0.476
2.58%
jan 1, 2013
25.754
+6.853
36.25%
jan 1, 2014
25.233
-0.521
-2.02%
jan 1, 2015
24.84
-0.392
-1.55%
Ranking of countries by current statistics by years


Comments: