29
/
en
AIzaSyAYiBZKx7MnpbEhh9jyipgxe19OcubqV5w
April 1, 2024
112169
Costa Rica
CRI
true
2
1
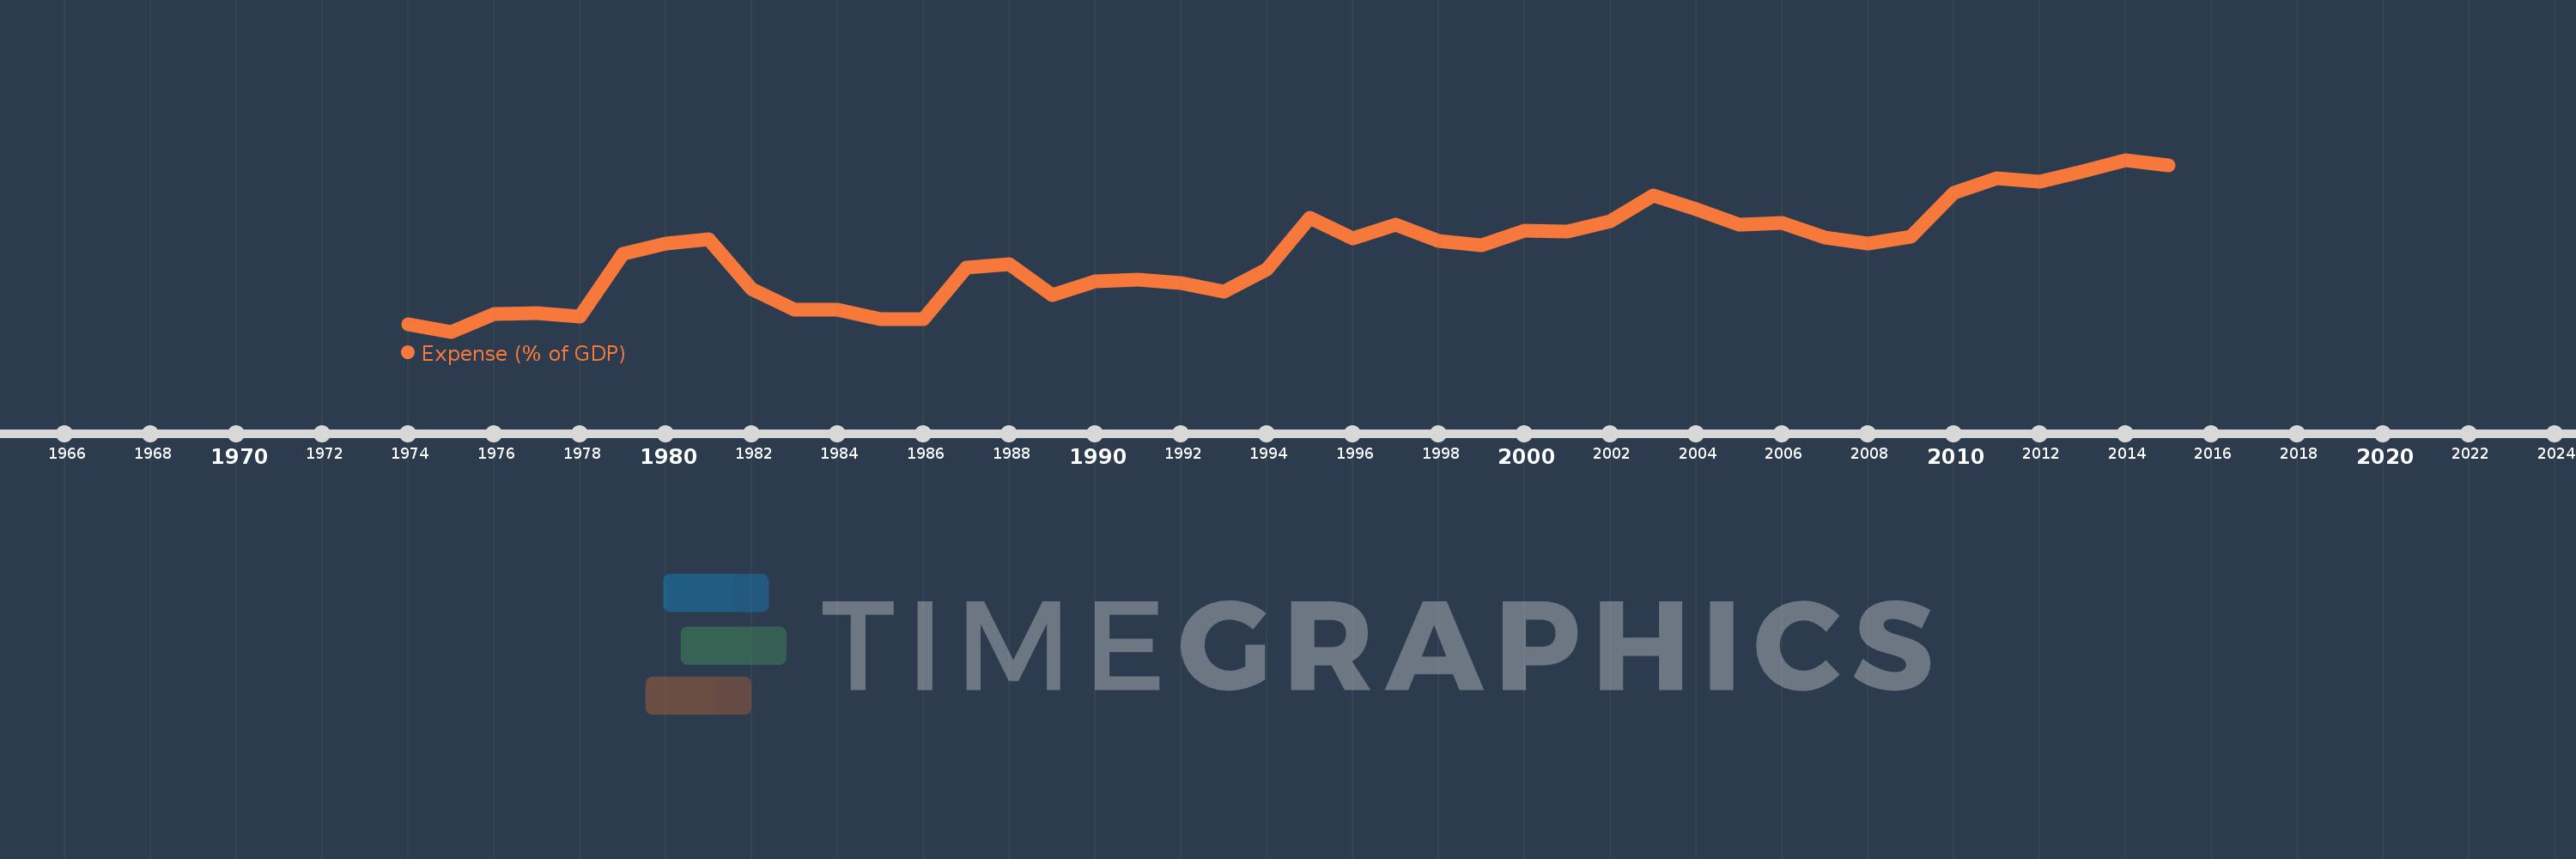
Expense (% of GDP)
2015,2014,2013,2012,2011,2010,2009,2008,2007,2006,2005,2004,2003,2002,2001,2000,1999,1998,1997,1996,1995,1994,1993,1992,1991,1990,1989,1988,1987,1986,1985,1984,1983,1982,1981,1980,1979,1978,1977,1976,1975,1974
This statistics in other country:
AfghanistanAlbaniaAlgeriaAngolaAntigua and BarbudaArmeniaAustraliaAustriaAzerbaijanBahamas, TheBahrainBangladeshBarbadosBelarusBelgiumBelizeBeninBhutanBoliviaBosnia and HerzegovinaBotswanaBrazilBulgariaBurkina FasoBurundiCabo VerdeCambodiaCanadaCaribbean small statesCentral African RepublicCentral Europe and the BalticsChileColombiaCongo, Dem. Rep.Congo, Rep.Costa RicaCote d'IvoireCroatiaCyprusCzech RepublicDenmarkDominicaDominican RepublicEarly-demographic dividendEgypt, Arab Rep.El SalvadorEquatorial GuineaEstoniaEthiopiaEuro areaEurope & Central AsiaEurope & Central Asia (excluding high income)Europe & Central Asia (IDA & IBRD countries)European UnionFijiFinlandFranceGambia, TheGeorgiaGermanyGhanaGreeceGrenadaGuatemalaHeavily indebted poor countries (HIPC)High incomeHondurasHong Kong SAR, ChinaHungaryIcelandIDA blendIDA onlyIDA totalIndiaIndonesiaIran, Islamic Rep.IraqIrelandIsraelItalyJamaicaJapanJordanKazakhstanKenyaKiribatiKorea, Rep.KuwaitKyrgyz RepublicLao PDRLatin America & Caribbean Latin America & Caribbean (excluding high income)Latin America & the Caribbean (IDA & IBRD countries)LatviaLeast developed countries: UN classificationLebanonLesothoLiberiaLithuaniaLow incomeLower middle incomeLuxembourgMacao SAR, ChinaMacedonia, FYRMadagascarMalawiMalaysiaMaldivesMaliMaltaMauritiusMexicoMicronesia, Fed. Sts.Middle East & North Africa (excluding high income)Middle East & North Africa (IDA & IBRD countries)MoldovaMongoliaMoroccoMozambiqueMyanmarNamibiaNepalNetherlandsNew ZealandNicaraguaNigeriaNorth AmericaNorwayOECD membersOmanOther small statesPacific island small statesPakistanPanamaPapua New GuineaParaguayPeruPhilippinesPolandPortugalPost-demographic dividendPre-demographic dividendQatarRomaniaRussian FederationRwandaSamoaSan MarinoSao Tome and PrincipeSenegalSerbiaSeychellesSierra LeoneSingaporeSlovak RepublicSloveniaSmall statesSolomon IslandsSouth AfricaSouth AsiaSouth Asia (IDA & IBRD)SpainSri LankaSt. Kitts and NevisSt. LuciaSub-Saharan Africa Sub-Saharan Africa (excluding high income)Sub-Saharan Africa (IDA & IBRD countries)SurinameSwazilandSwedenSwitzerlandSyrian Arab RepublicTajikistanTanzaniaThailandTimor-LesteTogoTrinidad and TobagoTunisiaTurkeyUgandaUkraineUnited Arab EmiratesUnited KingdomUnited StatesUruguayVanuatuVenezuela, RBVietnamWest Bank and GazaWorldYemen, Rep.ZambiaZimbabwe Timeline:
This timeline shows a graph from 1974 to 2015 of Costa Rica. No data until 1973. Number of actual observations by date: 42.
Source name:
World Development Indicators
Source organization:
International Monetary Fund, Government Finance Statistics Yearbook and data files, and World Bank and OECD GDP estimates.
Categories, topics:
Economy & Growth, Public Sector
Last updated:
apr 23, 2017
Indicators value changes by year
Minimum:
15.058
jan 1, 1975
Maximum:
27.218
jan 1, 2014
At the date of observation
Value
Absolute change
Change from previous value
jan 1, 1974
15.548
+15.548
0.0%
jan 1, 1975
15.058
-0.49
-3.15%
jan 1, 1976
16.305
+1.247
8.28%
jan 1, 1977
16.348
+0.043
0.26%
jan 1, 1978
16.141
-0.207
-1.27%
jan 1, 1979
20.534
+4.393
27.22%
jan 1, 1980
21.281
+0.747
3.64%
jan 1, 1981
21.591
+0.31
1.46%
jan 1, 1982
18.09
-3.501
-16.22%
jan 1, 1983
16.625
-1.465
-8.1%
jan 1, 1984
16.596
-0.028
-0.17%
jan 1, 1985
15.955
-0.642
-3.87%
jan 1, 1986
15.939
-0.015
-0.1%
jan 1, 1987
19.567
+3.628
22.76%
jan 1, 1988
19.836
+0.269
1.38%
jan 1, 1989
17.666
-2.17
-10.94%
jan 1, 1990
18.629
+0.962
5.45%
jan 1, 1991
18.709
+0.08
0.43%
jan 1, 1992
18.488
-0.22
-1.18%
jan 1, 1993
17.856
-0.633
-3.42%
jan 1, 1994
19.456
+1.6
8.96%
jan 1, 1995
23.121
+3.665
18.84%
jan 1, 1996
21.663
-1.458
-6.31%
jan 1, 1997
22.608
+0.945
4.36%
jan 1, 1998
21.501
-1.107
-4.9%
jan 1, 1999
21.165
-0.336
-1.56%
jan 1, 2000
22.216
+1.051
4.96%
jan 1, 2001
22.129
-0.087
-0.39%
jan 1, 2002
22.849
+0.72
3.25%
jan 1, 2003
24.705
+1.857
8.13%
jan 1, 2004
23.726
-0.979
-3.96%
jan 1, 2005
22.625
-1.101
-4.64%
jan 1, 2006
22.751
+0.127
0.56%
jan 1, 2007
21.709
-1.042
-4.58%
jan 1, 2008
21.272
-0.437
-2.01%
jan 1, 2009
21.803
+0.53
2.49%
jan 1, 2010
24.893
+3.091
14.18%
jan 1, 2011
25.882
+0.988
3.97%
jan 1, 2012
25.679
-0.203
-0.78%
jan 1, 2013
26.368
+0.689
2.68%
jan 1, 2014
27.218
+0.849
3.22%
jan 1, 2015
26.813
-0.405
-1.49%
Ranking of countries by current statistics by years


Comments: