29
/
en
AIzaSyAYiBZKx7MnpbEhh9jyipgxe19OcubqV5w
April 1, 2024
133083
Finland
FIN
true
2
1
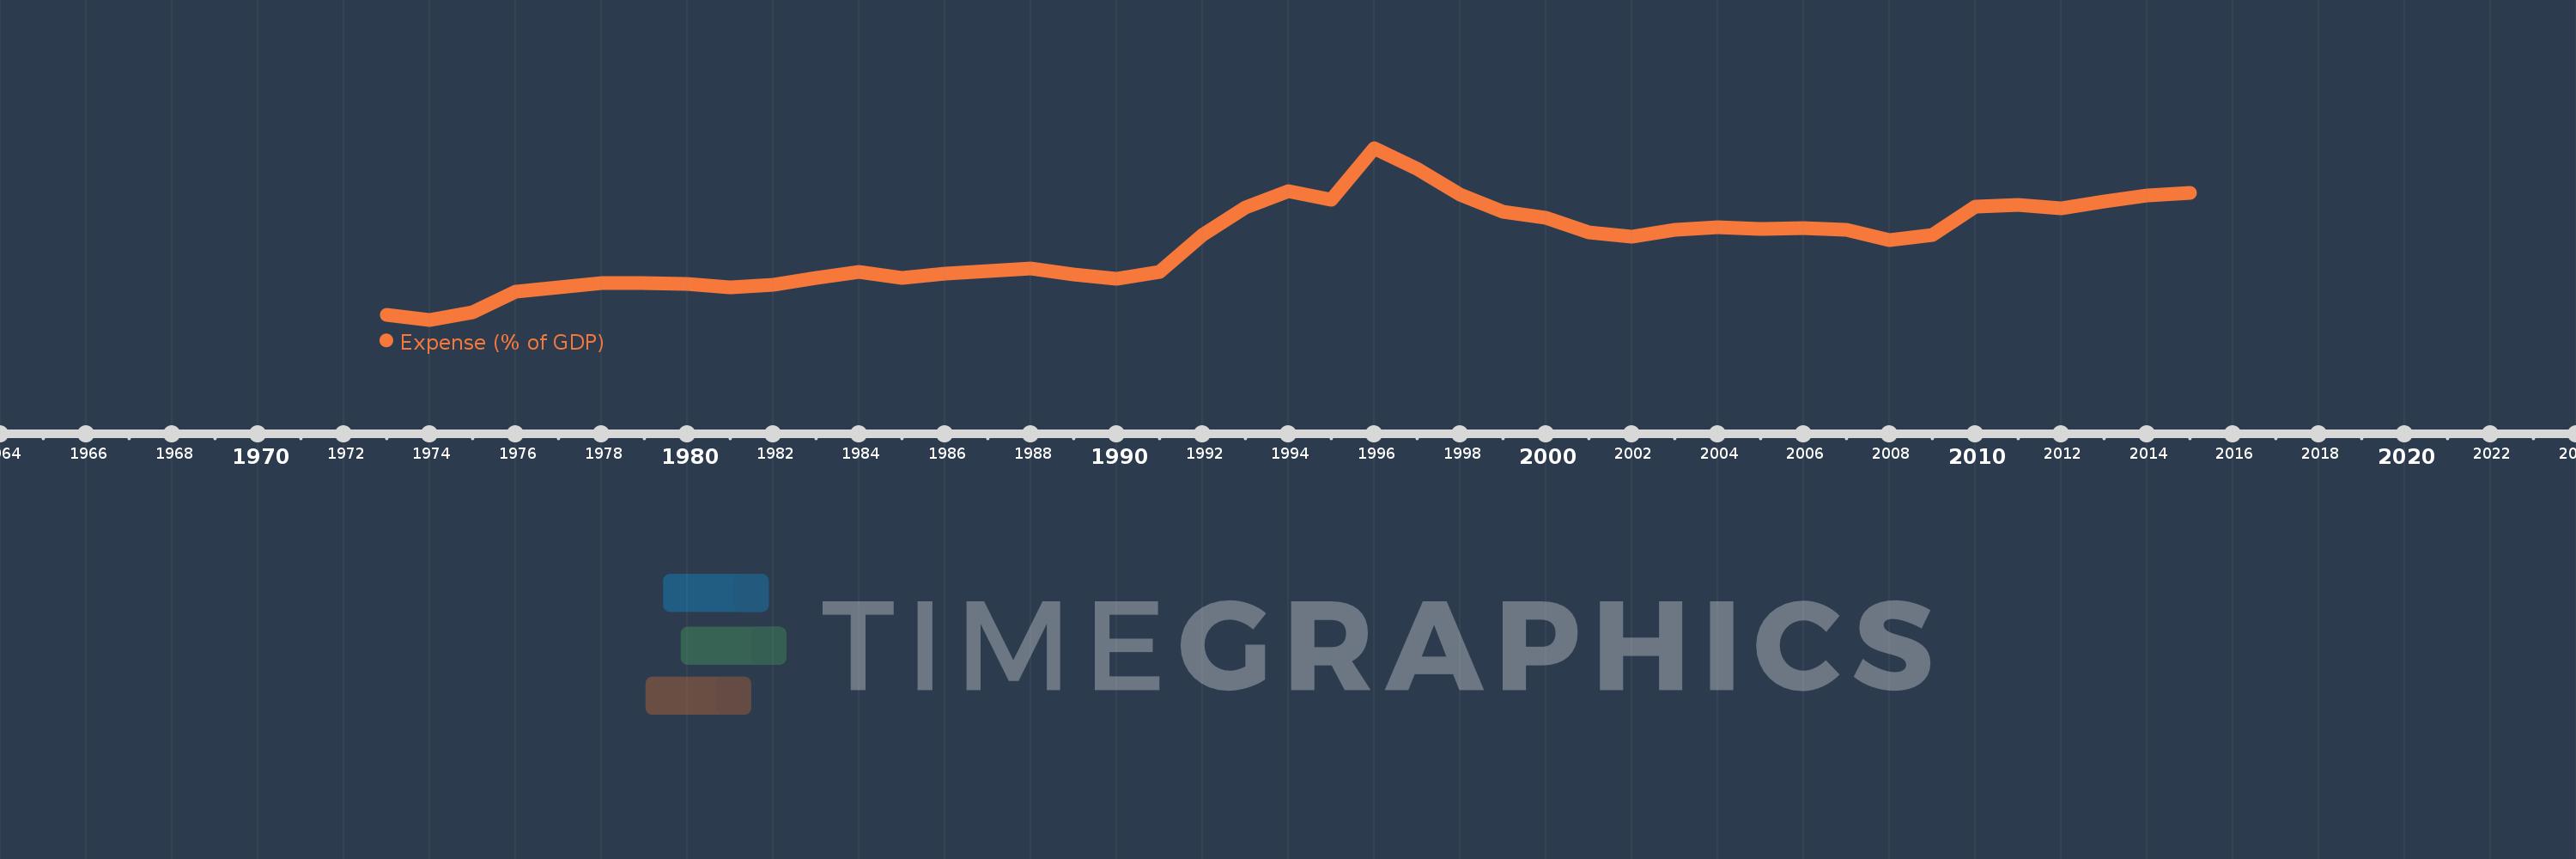
Expense (% of GDP)
2015,2014,2013,2012,2011,2010,2009,2008,2007,2006,2005,2004,2003,2002,2001,2000,1999,1998,1997,1996,1995,1994,1993,1992,1991,1990,1989,1988,1987,1986,1985,1984,1983,1982,1981,1980,1979,1978,1977,1976,1975,1974,1973
This statistics in other country:
AfghanistanAlbaniaAlgeriaAngolaAntigua and BarbudaArmeniaAustraliaAustriaAzerbaijanBahamas, TheBahrainBangladeshBarbadosBelarusBelgiumBelizeBeninBhutanBoliviaBosnia and HerzegovinaBotswanaBrazilBulgariaBurkina FasoBurundiCabo VerdeCambodiaCanadaCaribbean small statesCentral African RepublicCentral Europe and the BalticsChileColombiaCongo, Dem. Rep.Congo, Rep.Costa RicaCote d'IvoireCroatiaCyprusCzech RepublicDenmarkDominicaDominican RepublicEarly-demographic dividendEgypt, Arab Rep.El SalvadorEquatorial GuineaEstoniaEthiopiaEuro areaEurope & Central AsiaEurope & Central Asia (excluding high income)Europe & Central Asia (IDA & IBRD countries)European UnionFijiFinlandFranceGambia, TheGeorgiaGermanyGhanaGreeceGrenadaGuatemalaHeavily indebted poor countries (HIPC)High incomeHondurasHong Kong SAR, ChinaHungaryIcelandIDA blendIDA onlyIDA totalIndiaIndonesiaIran, Islamic Rep.IraqIrelandIsraelItalyJamaicaJapanJordanKazakhstanKenyaKiribatiKorea, Rep.KuwaitKyrgyz RepublicLao PDRLatin America & Caribbean Latin America & Caribbean (excluding high income)Latin America & the Caribbean (IDA & IBRD countries)LatviaLeast developed countries: UN classificationLebanonLesothoLiberiaLithuaniaLow incomeLower middle incomeLuxembourgMacao SAR, ChinaMacedonia, FYRMadagascarMalawiMalaysiaMaldivesMaliMaltaMauritiusMexicoMicronesia, Fed. Sts.Middle East & North Africa (excluding high income)Middle East & North Africa (IDA & IBRD countries)MoldovaMongoliaMoroccoMozambiqueMyanmarNamibiaNepalNetherlandsNew ZealandNicaraguaNigeriaNorth AmericaNorwayOECD membersOmanOther small statesPacific island small statesPakistanPanamaPapua New GuineaParaguayPeruPhilippinesPolandPortugalPost-demographic dividendPre-demographic dividendQatarRomaniaRussian FederationRwandaSamoaSan MarinoSao Tome and PrincipeSenegalSerbiaSeychellesSierra LeoneSingaporeSlovak RepublicSloveniaSmall statesSolomon IslandsSouth AfricaSouth AsiaSouth Asia (IDA & IBRD)SpainSri LankaSt. Kitts and NevisSt. LuciaSub-Saharan Africa Sub-Saharan Africa (excluding high income)Sub-Saharan Africa (IDA & IBRD countries)SurinameSwazilandSwedenSwitzerlandSyrian Arab RepublicTajikistanTanzaniaThailandTimor-LesteTogoTrinidad and TobagoTunisiaTurkeyUgandaUkraineUnited Arab EmiratesUnited KingdomUnited StatesUruguayVanuatuVenezuela, RBVietnamWest Bank and GazaWorldYemen, Rep.ZambiaZimbabwe Timeline:
This timeline shows a graph from 1973 to 2015 of Finland. No data until 1972. Number of actual observations by date: 43.
Source name:
World Development Indicators
Source organization:
International Monetary Fund, Government Finance Statistics Yearbook and data files, and World Bank and OECD GDP estimates.
Categories, topics:
Economy & Growth, Public Sector
Last updated:
apr 23, 2017
Indicators value changes by year
Minimum:
19.858
jan 1, 1974
Maximum:
49.348
jan 1, 1996
At the date of observation
Value
Absolute change
Change from previous value
jan 1, 1973
20.643
+20.643
0.0%
jan 1, 1974
19.858
-0.785
-3.8%
jan 1, 1975
21.073
+1.216
6.12%
jan 1, 1976
24.691
+3.618
17.17%
jan 1, 1977
25.365
+0.674
2.73%
jan 1, 1978
26.164
+0.799
3.15%
jan 1, 1979
26.149
-0.015
-0.06%
jan 1, 1980
25.975
-0.174
-0.67%
jan 1, 1981
25.356
-0.619
-2.38%
jan 1, 1982
25.805
+0.449
1.77%
jan 1, 1983
27.034
+1.229
4.76%
jan 1, 1984
28.061
+1.027
3.8%
jan 1, 1985
26.985
-1.076
-3.84%
jan 1, 1986
27.794
+0.809
3.0%
jan 1, 1987
28.228
+0.435
1.56%
jan 1, 1988
28.707
+0.479
1.7%
jan 1, 1989
27.591
-1.115
-3.89%
jan 1, 1990
26.868
-0.723
-2.62%
jan 1, 1991
28.14
+1.271
4.73%
jan 1, 1992
34.408
+6.269
22.28%
jan 1, 1993
39.094
+4.686
13.62%
jan 1, 1994
41.884
+2.789
7.14%
jan 1, 1995
40.422
-1.461
-3.49%
jan 1, 1996
49.348
+8.925
22.08%
jan 1, 1997
45.734
-3.614
-7.32%
jan 1, 1998
41.273
-4.461
-9.75%
jan 1, 1999
38.389
-2.884
-6.99%
jan 1, 2000
37.357
-1.032
-2.69%
jan 1, 2001
34.781
-2.575
-6.89%
jan 1, 2002
34.128
-0.653
-1.88%
jan 1, 2003
35.243
+1.115
3.27%
jan 1, 2004
35.791
+0.548
1.55%
jan 1, 2005
35.499
-0.292
-0.82%
jan 1, 2006
35.617
+0.117
0.33%
jan 1, 2007
35.228
-0.388
-1.09%
jan 1, 2008
33.6
-1.628
-4.62%
jan 1, 2009
34.35
+0.75
2.23%
jan 1, 2010
39.348
+4.998
14.55%
jan 1, 2011
39.588
+0.241
0.61%
jan 1, 2012
39.02
-0.569
-1.44%
jan 1, 2013
40.108
+1.088
2.79%
jan 1, 2014
41.171
+1.064
2.65%
jan 1, 2015
41.705
+0.534
1.3%
Ranking of countries by current statistics by years


Comments: