29
/
en
AIzaSyAYiBZKx7MnpbEhh9jyipgxe19OcubqV5w
April 1, 2024
276584
United States
USA
true
2
1
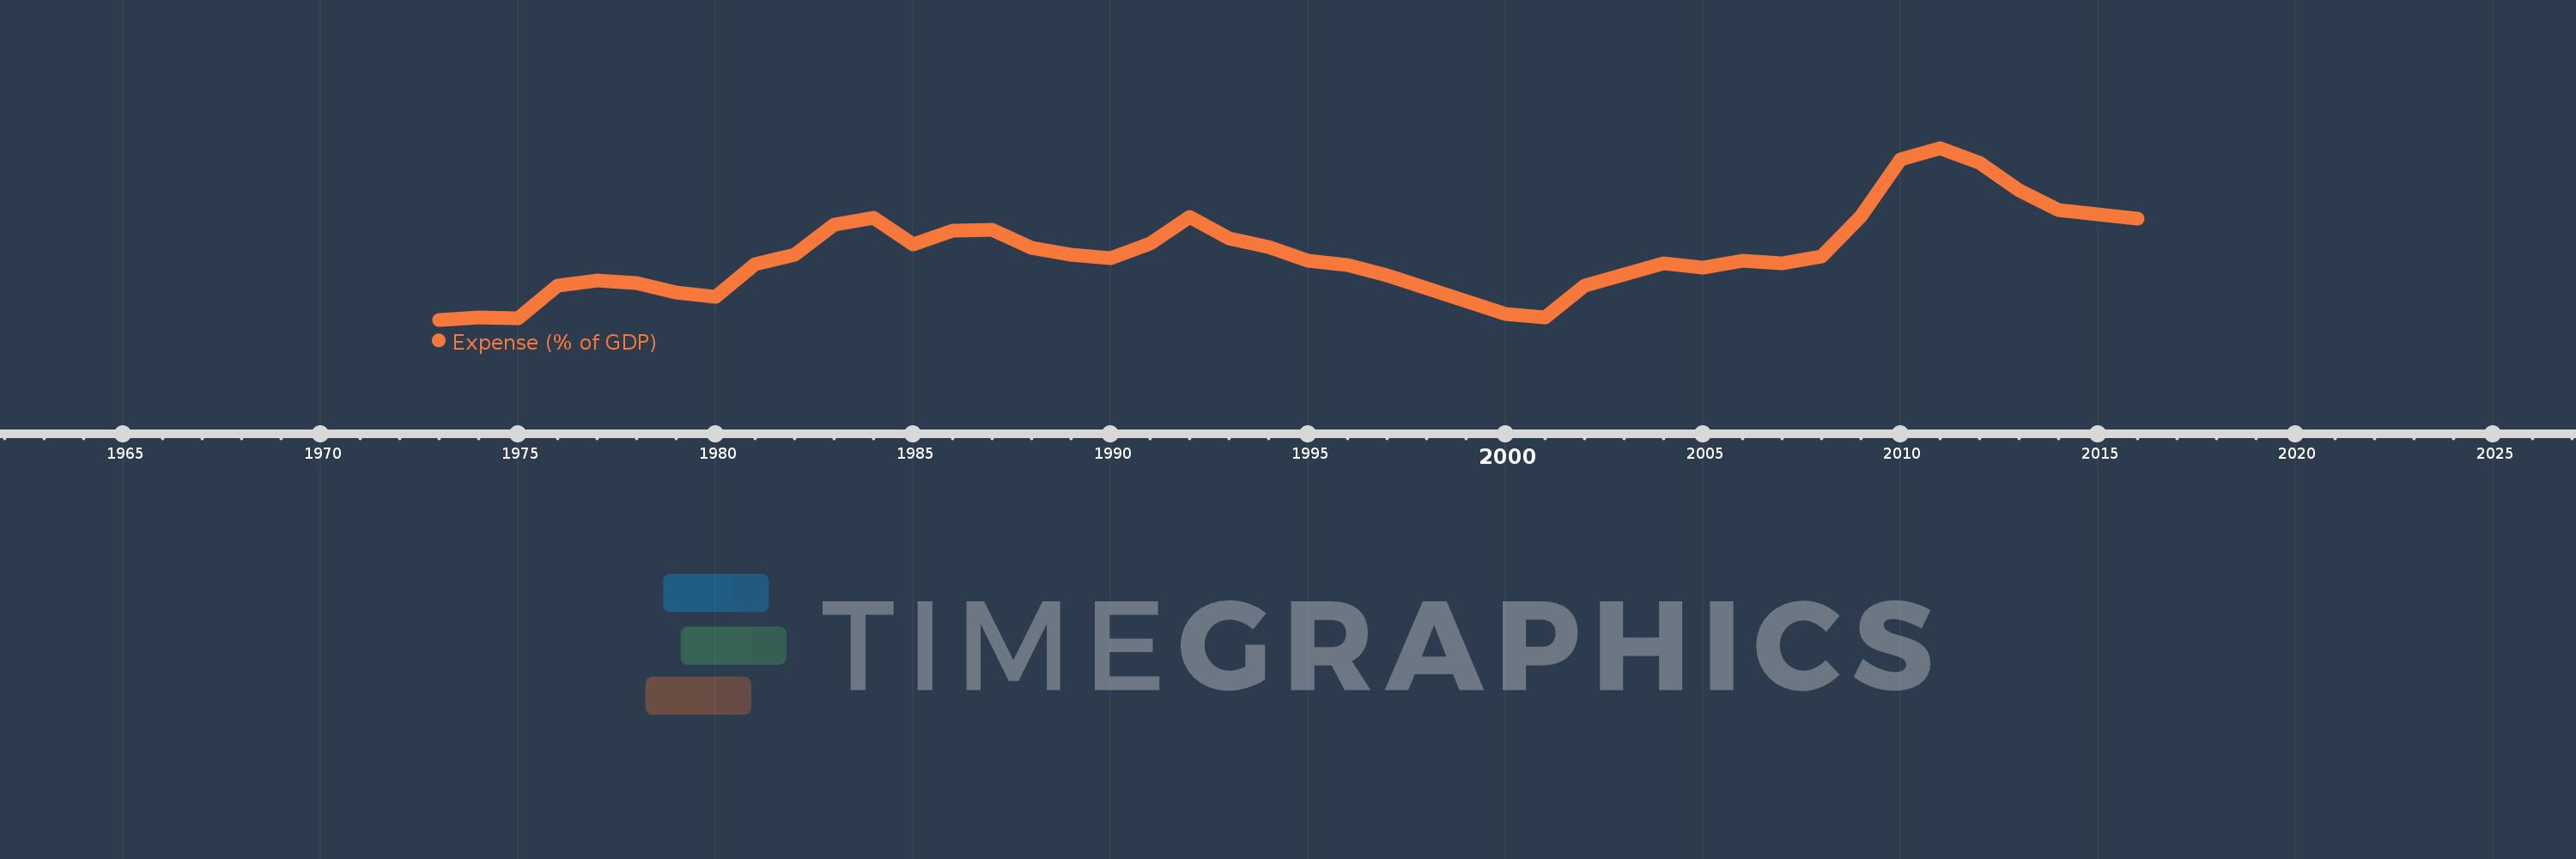
Expense (% of GDP)
2016,2015,2014,2013,2012,2011,2010,2009,2008,2007,2006,2005,2004,2003,2002,2001,2000,1999,1998,1997,1996,1995,1994,1993,1992,1991,1990,1989,1988,1987,1986,1985,1984,1983,1982,1981,1980,1979,1978,1977,1976,1975,1974,1973
This statistics in other country:
AfghanistanAlbaniaAlgeriaAngolaAntigua and BarbudaArmeniaAustraliaAustriaAzerbaijanBahamas, TheBahrainBangladeshBarbadosBelarusBelgiumBelizeBeninBhutanBoliviaBosnia and HerzegovinaBotswanaBrazilBulgariaBurkina FasoBurundiCabo VerdeCambodiaCanadaCaribbean small statesCentral African RepublicCentral Europe and the BalticsChileColombiaCongo, Dem. Rep.Congo, Rep.Costa RicaCote d'IvoireCroatiaCyprusCzech RepublicDenmarkDominicaDominican RepublicEarly-demographic dividendEgypt, Arab Rep.El SalvadorEquatorial GuineaEstoniaEthiopiaEuro areaEurope & Central AsiaEurope & Central Asia (excluding high income)Europe & Central Asia (IDA & IBRD countries)European UnionFijiFinlandFranceGambia, TheGeorgiaGermanyGhanaGreeceGrenadaGuatemalaHeavily indebted poor countries (HIPC)High incomeHondurasHong Kong SAR, ChinaHungaryIcelandIDA blendIDA onlyIDA totalIndiaIndonesiaIran, Islamic Rep.IraqIrelandIsraelItalyJamaicaJapanJordanKazakhstanKenyaKiribatiKorea, Rep.KuwaitKyrgyz RepublicLao PDRLatin America & Caribbean Latin America & Caribbean (excluding high income)Latin America & the Caribbean (IDA & IBRD countries)LatviaLeast developed countries: UN classificationLebanonLesothoLiberiaLithuaniaLow incomeLower middle incomeLuxembourgMacao SAR, ChinaMacedonia, FYRMadagascarMalawiMalaysiaMaldivesMaliMaltaMauritiusMexicoMicronesia, Fed. Sts.Middle East & North Africa (excluding high income)Middle East & North Africa (IDA & IBRD countries)MoldovaMongoliaMoroccoMozambiqueMyanmarNamibiaNepalNetherlandsNew ZealandNicaraguaNigeriaNorth AmericaNorwayOECD membersOmanOther small statesPacific island small statesPakistanPanamaPapua New GuineaParaguayPeruPhilippinesPolandPortugalPost-demographic dividendPre-demographic dividendQatarRomaniaRussian FederationRwandaSamoaSan MarinoSao Tome and PrincipeSenegalSerbiaSeychellesSierra LeoneSingaporeSlovak RepublicSloveniaSmall statesSolomon IslandsSouth AfricaSouth AsiaSouth Asia (IDA & IBRD)SpainSri LankaSt. Kitts and NevisSt. LuciaSub-Saharan Africa Sub-Saharan Africa (excluding high income)Sub-Saharan Africa (IDA & IBRD countries)SurinameSwazilandSwedenSwitzerlandSyrian Arab RepublicTajikistanTanzaniaThailandTimor-LesteTogoTrinidad and TobagoTunisiaTurkeyUgandaUkraineUnited Arab EmiratesUnited KingdomUnited StatesUruguayVanuatuVenezuela, RBVietnamWest Bank and GazaWorldYemen, Rep.ZambiaZimbabwe Timeline:
This timeline shows a graph from 1973 to 2016 of United States. No data until 1972. Number of actual observations by date: 44.
Source name:
World Development Indicators
Source organization:
International Monetary Fund, Government Finance Statistics Yearbook and data files, and World Bank and OECD GDP estimates.
Categories, topics:
Economy & Growth, Public Sector
Last updated:
apr 23, 2017
Indicators value changes by year
Minimum:
17.752
jan 1, 1973
Maximum:
26.225
jan 1, 2011
At the date of observation
Value
Absolute change
Change from previous value
jan 1, 1973
17.752
+17.752
0.0%
jan 1, 1974
17.857
+0.105
0.59%
jan 1, 1975
17.841
-0.015
-0.09%
jan 1, 1976
19.424
+1.583
8.87%
jan 1, 1977
19.689
+0.264
1.36%
jan 1, 1978
19.564
-0.124
-0.63%
jan 1, 1979
19.083
-0.481
-2.46%
jan 1, 1980
18.887
-0.197
-1.03%
jan 1, 1981
20.507
+1.62
8.58%
jan 1, 1982
20.979
+0.472
2.3%
jan 1, 1983
22.455
+1.476
7.04%
jan 1, 1984
22.777
+0.322
1.43%
jan 1, 1985
21.454
-1.323
-5.81%
jan 1, 1986
22.135
+0.681
3.18%
jan 1, 1987
22.18
+0.044
0.2%
jan 1, 1988
21.308
-0.871
-3.93%
jan 1, 1989
20.966
-0.343
-1.61%
jan 1, 1990
20.804
-0.162
-0.77%
jan 1, 1991
21.5
+0.696
3.35%
jan 1, 1992
22.825
+1.326
6.17%
jan 1, 1993
21.755
-1.07
-4.69%
jan 1, 1994
21.355
-0.4
-1.84%
jan 1, 1995
20.67
-0.684
-3.2%
jan 1, 1996
20.468
-0.203
-0.98%
jan 1, 1997
19.939
-0.529
-2.59%
jan 1, 1998
19.32
-0.619
-3.1%
jan 1, 1999
18.667
-0.653
-3.38%
jan 1, 2000
18.049
-0.618
-3.31%
jan 1, 2001
17.868
-0.182
-1.01%
jan 1, 2002
19.434
+1.566
8.77%
jan 1, 2003
19.995
+0.561
2.89%
jan 1, 2004
20.555
+0.56
2.8%
jan 1, 2005
20.339
-0.216
-1.05%
jan 1, 2006
20.646
+0.307
1.51%
jan 1, 2007
20.53
-0.116
-0.56%
jan 1, 2008
20.855
+0.325
1.58%
jan 1, 2009
22.882
+2.027
9.72%
jan 1, 2010
25.678
+2.796
12.22%
jan 1, 2011
26.225
+0.548
2.13%
jan 1, 2012
25.506
-0.719
-2.74%
jan 1, 2013
24.124
-1.382
-5.42%
jan 1, 2014
23.183
-0.941
-3.9%
jan 1, 2015
22.936
-0.247
-1.07%
jan 1, 2016
22.756
-0.18
-0.79%
Ranking of countries by current statistics by years


Comments: