30
/
AIzaSyAYiBZKx7MnpbEhh9jyipgxe19OcubqV5w
April 1, 2024
43379
Latin America & the Caribbean (IDA & IBRD countries)
TLA
false
2
1
Expense (% of GDP)
2001,2000,1999,1998,1995,1994,1993,1992,1991,1990,1989,1988,1987,1986,1985,1984,1983,1982,1981
Download
Global statistics library →Latin America & the Caribbean (IDA & IBRD countries) →

Expense (% of GDP)

This statistics in other country:

AfghanistanAlbaniaAlgeriaAngolaAntigua and BarbudaArmeniaAustraliaAustriaAzerbaijanBahamas, TheBahrainBangladeshBarbadosBelarusBelgiumBelizeBeninBhutanBoliviaBosnia and HerzegovinaBotswanaBrazilBulgariaBurkina FasoBurundiCabo VerdeCambodiaCanadaCaribbean small statesCentral African RepublicCentral Europe and the BalticsChileColombiaCongo, Dem. Rep.Congo, Rep.Costa RicaCote d'IvoireCroatiaCyprusCzech RepublicDenmarkDominicaDominican RepublicEarly-demographic dividendEgypt, Arab Rep.El SalvadorEquatorial GuineaEstoniaEthiopiaEuro areaEurope & Central AsiaEurope & Central Asia (excluding high income)Europe & Central Asia (IDA & IBRD countries)European UnionFijiFinlandFranceGambia, TheGeorgiaGermanyGhanaGreeceGrenadaGuatemalaHeavily indebted poor countries (HIPC)High incomeHondurasHong Kong SAR, ChinaHungaryIcelandIDA blendIDA onlyIDA totalIndiaIndonesiaIran, Islamic Rep.IraqIrelandIsraelItalyJamaicaJapanJordanKazakhstanKenyaKiribatiKorea, Rep.KuwaitKyrgyz RepublicLao PDRLatin America & Caribbean Latin America & Caribbean (excluding high income)Latin America & the Caribbean (IDA & IBRD countries)LatviaLeast developed countries: UN classificationLebanonLesothoLiberiaLithuaniaLow incomeLower middle incomeLuxembourgMacao SAR, ChinaMacedonia, FYRMadagascarMalawiMalaysiaMaldivesMaliMaltaMauritiusMexicoMicronesia, Fed. Sts.Middle East & North Africa (excluding high income)Middle East & North Africa (IDA & IBRD countries)MoldovaMongoliaMoroccoMozambiqueMyanmarNamibiaNepalNetherlandsNew ZealandNicaraguaNigeriaNorth AmericaNorwayOECD membersOmanOther small statesPacific island small statesPakistanPanamaPapua New GuineaParaguayPeruPhilippinesPolandPortugalPost-demographic dividendPre-demographic dividendQatarRomaniaRussian FederationRwandaSamoaSan MarinoSao Tome and PrincipeSenegalSerbiaSeychellesSierra LeoneSingaporeSlovak RepublicSloveniaSmall statesSolomon IslandsSouth AfricaSouth AsiaSouth Asia (IDA & IBRD)SpainSri LankaSt. Kitts and NevisSt. LuciaSub-Saharan Africa Sub-Saharan Africa (excluding high income)Sub-Saharan Africa (IDA & IBRD countries)SurinameSwazilandSwedenSwitzerlandSyrian Arab RepublicTajikistanTanzaniaThailandTimor-LesteTogoTrinidad and TobagoTunisiaTurkeyUgandaUkraineUnited Arab EmiratesUnited KingdomUnited StatesUruguayVanuatuVenezuela, RBVietnamWest Bank and GazaWorldYemen, Rep.ZambiaZimbabwe

Timeline:

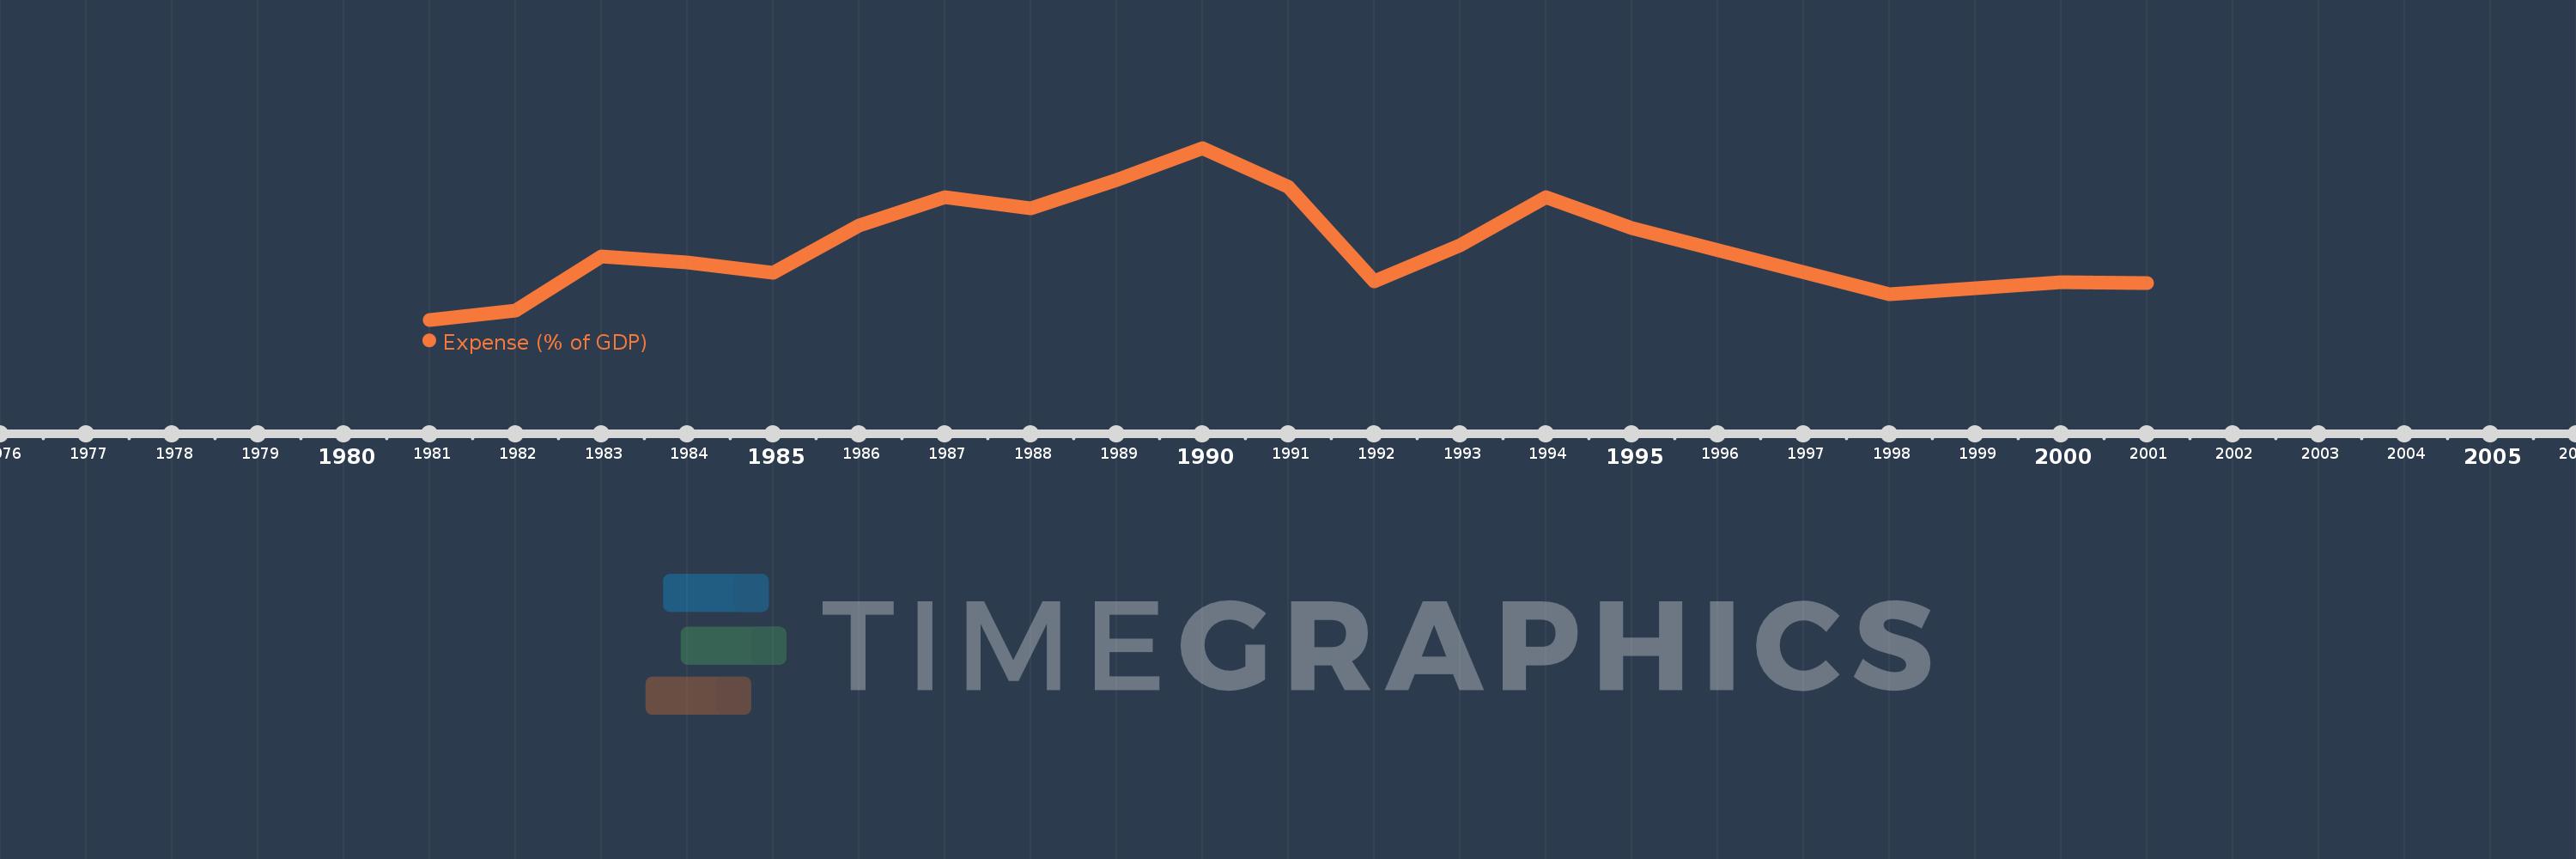
This timeline shows a graph from 1981 to 2001 of Latin America & the Caribbean (IDA & IBRD countries). No data until 1980. Number of actual observations by date: 19.

Source name:

World Development Indicators

Source organization:

International Monetary Fund, Government Finance Statistics Yearbook and data files, and World Bank and OECD GDP estimates.

Categories, topics:

Economy & Growth, Public Sector

Last updated:

apr 23, 2017

Indicators value changes by year

Meaning:
21.869
Minimum:
16.774
jan 1, 1981
Maximum:
28.579
jan 1, 1990
At the date of observation
Value
Absolute change
Change from the previous value
jan 1, 1981
16.774
+16.774
0.0%
jan 1, 1982
17.435
+0.661
3.94%
jan 1, 1983
21.101
+3.666
21.03%
jan 1, 1984
20.705
-0.396
-1.88%
jan 1, 1985
20.001
-0.704
-3.4%
jan 1, 1986
23.25
+3.249
16.25%
jan 1, 1987
25.215
+1.964
8.45%
jan 1, 1988
24.455
-0.759
-3.01%
jan 1, 1989
26.367
+1.912
7.82%
jan 1, 1990
28.579
+2.212
8.39%
jan 1, 1991
25.926
-2.654
-9.29%
jan 1, 1992
19.397
-6.529
-25.18%
jan 1, 1993
21.914
+2.517
12.98%
jan 1, 1994
25.172
+3.258
14.87%
jan 1, 1995
23.059
-2.114
-8.4%
jan 1, 1998
18.543
-4.516
-19.58%
jan 1, 1999
18.956
+0.414
2.23%
jan 1, 2000
19.37
+0.413
2.18%
jan 1, 2001
19.291
-0.078
-0.4%

Ranking of countries by current statistics by years