29
/
en
AIzaSyAYiBZKx7MnpbEhh9jyipgxe19OcubqV5w
April 1, 2024
182019
Luxembourg
LUX
true
2
1
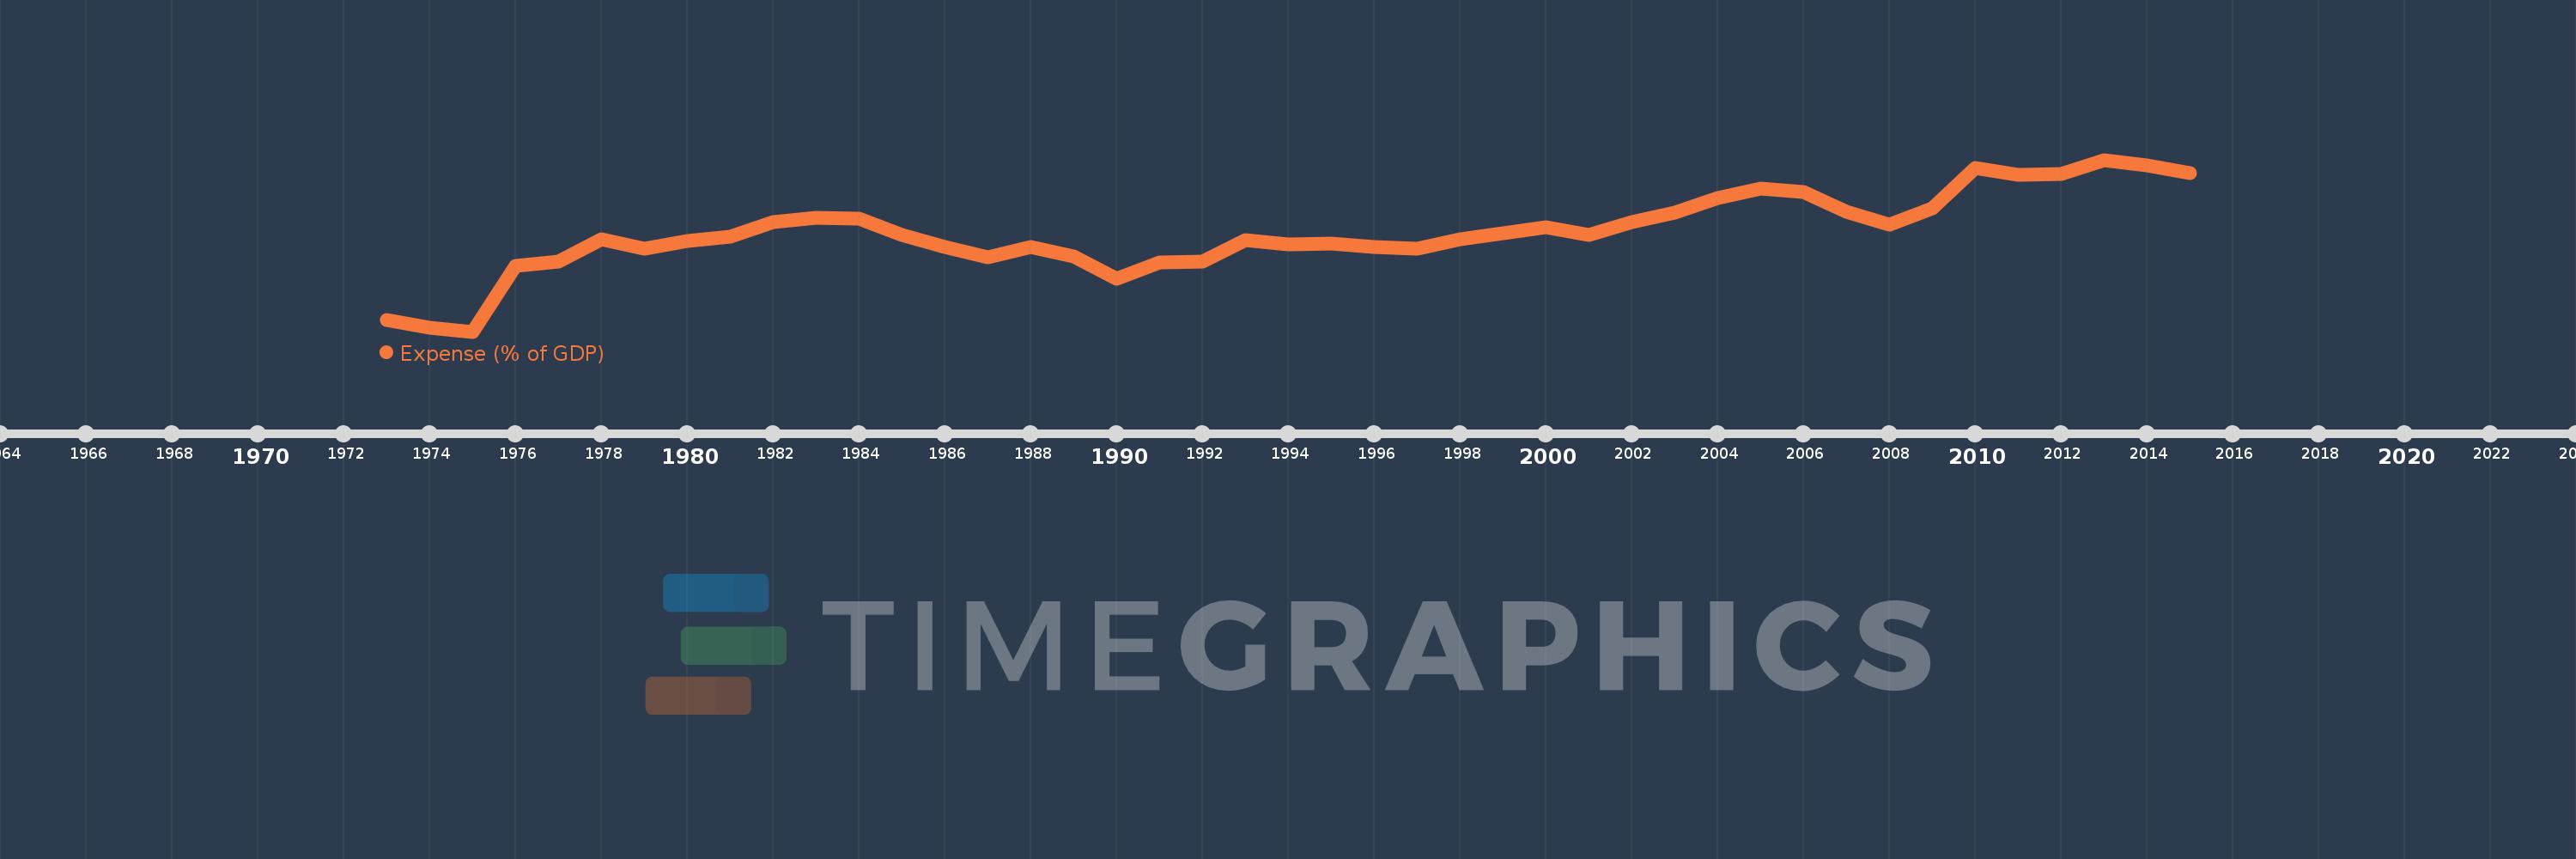
Expense (% of GDP)
2015,2014,2013,2012,2011,2010,2009,2008,2007,2006,2005,2004,2003,2002,2001,2000,1998,1997,1996,1995,1994,1993,1992,1991,1990,1989,1988,1987,1986,1985,1984,1983,1982,1981,1980,1979,1978,1977,1976,1975,1974,1973
This statistics in other country:
AfghanistanAlbaniaAlgeriaAngolaAntigua and BarbudaArmeniaAustraliaAustriaAzerbaijanBahamas, TheBahrainBangladeshBarbadosBelarusBelgiumBelizeBeninBhutanBoliviaBosnia and HerzegovinaBotswanaBrazilBulgariaBurkina FasoBurundiCabo VerdeCambodiaCanadaCaribbean small statesCentral African RepublicCentral Europe and the BalticsChileColombiaCongo, Dem. Rep.Congo, Rep.Costa RicaCote d'IvoireCroatiaCyprusCzech RepublicDenmarkDominicaDominican RepublicEarly-demographic dividendEgypt, Arab Rep.El SalvadorEquatorial GuineaEstoniaEthiopiaEuro areaEurope & Central AsiaEurope & Central Asia (excluding high income)Europe & Central Asia (IDA & IBRD countries)European UnionFijiFinlandFranceGambia, TheGeorgiaGermanyGhanaGreeceGrenadaGuatemalaHeavily indebted poor countries (HIPC)High incomeHondurasHong Kong SAR, ChinaHungaryIcelandIDA blendIDA onlyIDA totalIndiaIndonesiaIran, Islamic Rep.IraqIrelandIsraelItalyJamaicaJapanJordanKazakhstanKenyaKiribatiKorea, Rep.KuwaitKyrgyz RepublicLao PDRLatin America & Caribbean Latin America & Caribbean (excluding high income)Latin America & the Caribbean (IDA & IBRD countries)LatviaLeast developed countries: UN classificationLebanonLesothoLiberiaLithuaniaLow incomeLower middle incomeLuxembourgMacao SAR, ChinaMacedonia, FYRMadagascarMalawiMalaysiaMaldivesMaliMaltaMauritiusMexicoMicronesia, Fed. Sts.Middle East & North Africa (excluding high income)Middle East & North Africa (IDA & IBRD countries)MoldovaMongoliaMoroccoMozambiqueMyanmarNamibiaNepalNetherlandsNew ZealandNicaraguaNigeriaNorth AmericaNorwayOECD membersOmanOther small statesPacific island small statesPakistanPanamaPapua New GuineaParaguayPeruPhilippinesPolandPortugalPost-demographic dividendPre-demographic dividendQatarRomaniaRussian FederationRwandaSamoaSan MarinoSao Tome and PrincipeSenegalSerbiaSeychellesSierra LeoneSingaporeSlovak RepublicSloveniaSmall statesSolomon IslandsSouth AfricaSouth AsiaSouth Asia (IDA & IBRD)SpainSri LankaSt. Kitts and NevisSt. LuciaSub-Saharan Africa Sub-Saharan Africa (excluding high income)Sub-Saharan Africa (IDA & IBRD countries)SurinameSwazilandSwedenSwitzerlandSyrian Arab RepublicTajikistanTanzaniaThailandTimor-LesteTogoTrinidad and TobagoTunisiaTurkeyUgandaUkraineUnited Arab EmiratesUnited KingdomUnited StatesUruguayVanuatuVenezuela, RBVietnamWest Bank and GazaWorldYemen, Rep.ZambiaZimbabwe Timeline:
This timeline shows a graph from 1973 to 2015 of Luxembourg. No data until 1972. Number of actual observations by date: 42.
Source name:
World Development Indicators
Source organization:
International Monetary Fund, Government Finance Statistics Yearbook and data files, and World Bank and OECD GDP estimates.
Categories, topics:
Economy & Growth, Public Sector
Last updated:
apr 23, 2017
Indicators value changes by year
Minimum:
20.913
jan 1, 1975
Maximum:
41.506
jan 1, 2013
At the date of observation
Value
Absolute change
Change from previous value
jan 1, 1973
22.287
+22.287
0.0%
jan 1, 1974
21.336
-0.95
-4.26%
jan 1, 1975
20.913
-0.423
-1.98%
jan 1, 1976
28.82
+7.907
37.81%
jan 1, 1977
29.329
+0.509
1.77%
jan 1, 1978
31.984
+2.656
9.05%
jan 1, 1979
30.861
-1.123
-3.51%
jan 1, 1980
31.738
+0.877
2.84%
jan 1, 1981
32.283
+0.545
1.72%
jan 1, 1982
34.014
+1.731
5.36%
jan 1, 1983
34.582
+0.567
1.67%
jan 1, 1984
34.416
-0.166
-0.48%
jan 1, 1985
32.479
-1.936
-5.63%
jan 1, 1986
31.029
-1.45
-4.46%
jan 1, 1987
29.802
-1.227
-3.95%
jan 1, 1988
31.024
+1.222
4.1%
jan 1, 1989
29.884
-1.14
-3.67%
jan 1, 1990
27.195
-2.69
-9.0%
jan 1, 1991
29.234
+2.039
7.5%
jan 1, 1992
29.281
+0.047
0.16%
jan 1, 1993
31.833
+2.552
8.72%
jan 1, 1994
31.316
-0.517
-1.62%
jan 1, 1995
31.469
+0.153
0.49%
jan 1, 1996
31.06
-0.409
-1.3%
jan 1, 1997
30.879
-0.18
-0.58%
jan 1, 1998
31.986
+1.107
3.58%
jan 1, 2000
33.42
+1.434
4.48%
jan 1, 2001
32.504
-0.916
-2.74%
jan 1, 2002
34.008
+1.504
4.63%
jan 1, 2003
35.21
+1.203
3.54%
jan 1, 2004
36.947
+1.737
4.93%
jan 1, 2005
38.054
+1.106
2.99%
jan 1, 2006
37.677
-0.377
-0.99%
jan 1, 2007
35.266
-2.41
-6.4%
jan 1, 2008
33.754
-1.512
-4.29%
jan 1, 2009
35.705
+1.951
5.78%
jan 1, 2010
40.576
+4.871
13.64%
jan 1, 2011
39.747
-0.829
-2.04%
jan 1, 2012
39.774
+0.027
0.07%
jan 1, 2013
41.506
+1.732
4.35%
jan 1, 2014
40.815
-0.691
-1.66%
jan 1, 2015
39.925
-0.889
-2.18%
Ranking of countries by current statistics by years


Comments: