29
/
en
AIzaSyAYiBZKx7MnpbEhh9jyipgxe19OcubqV5w
April 1, 2024
141742
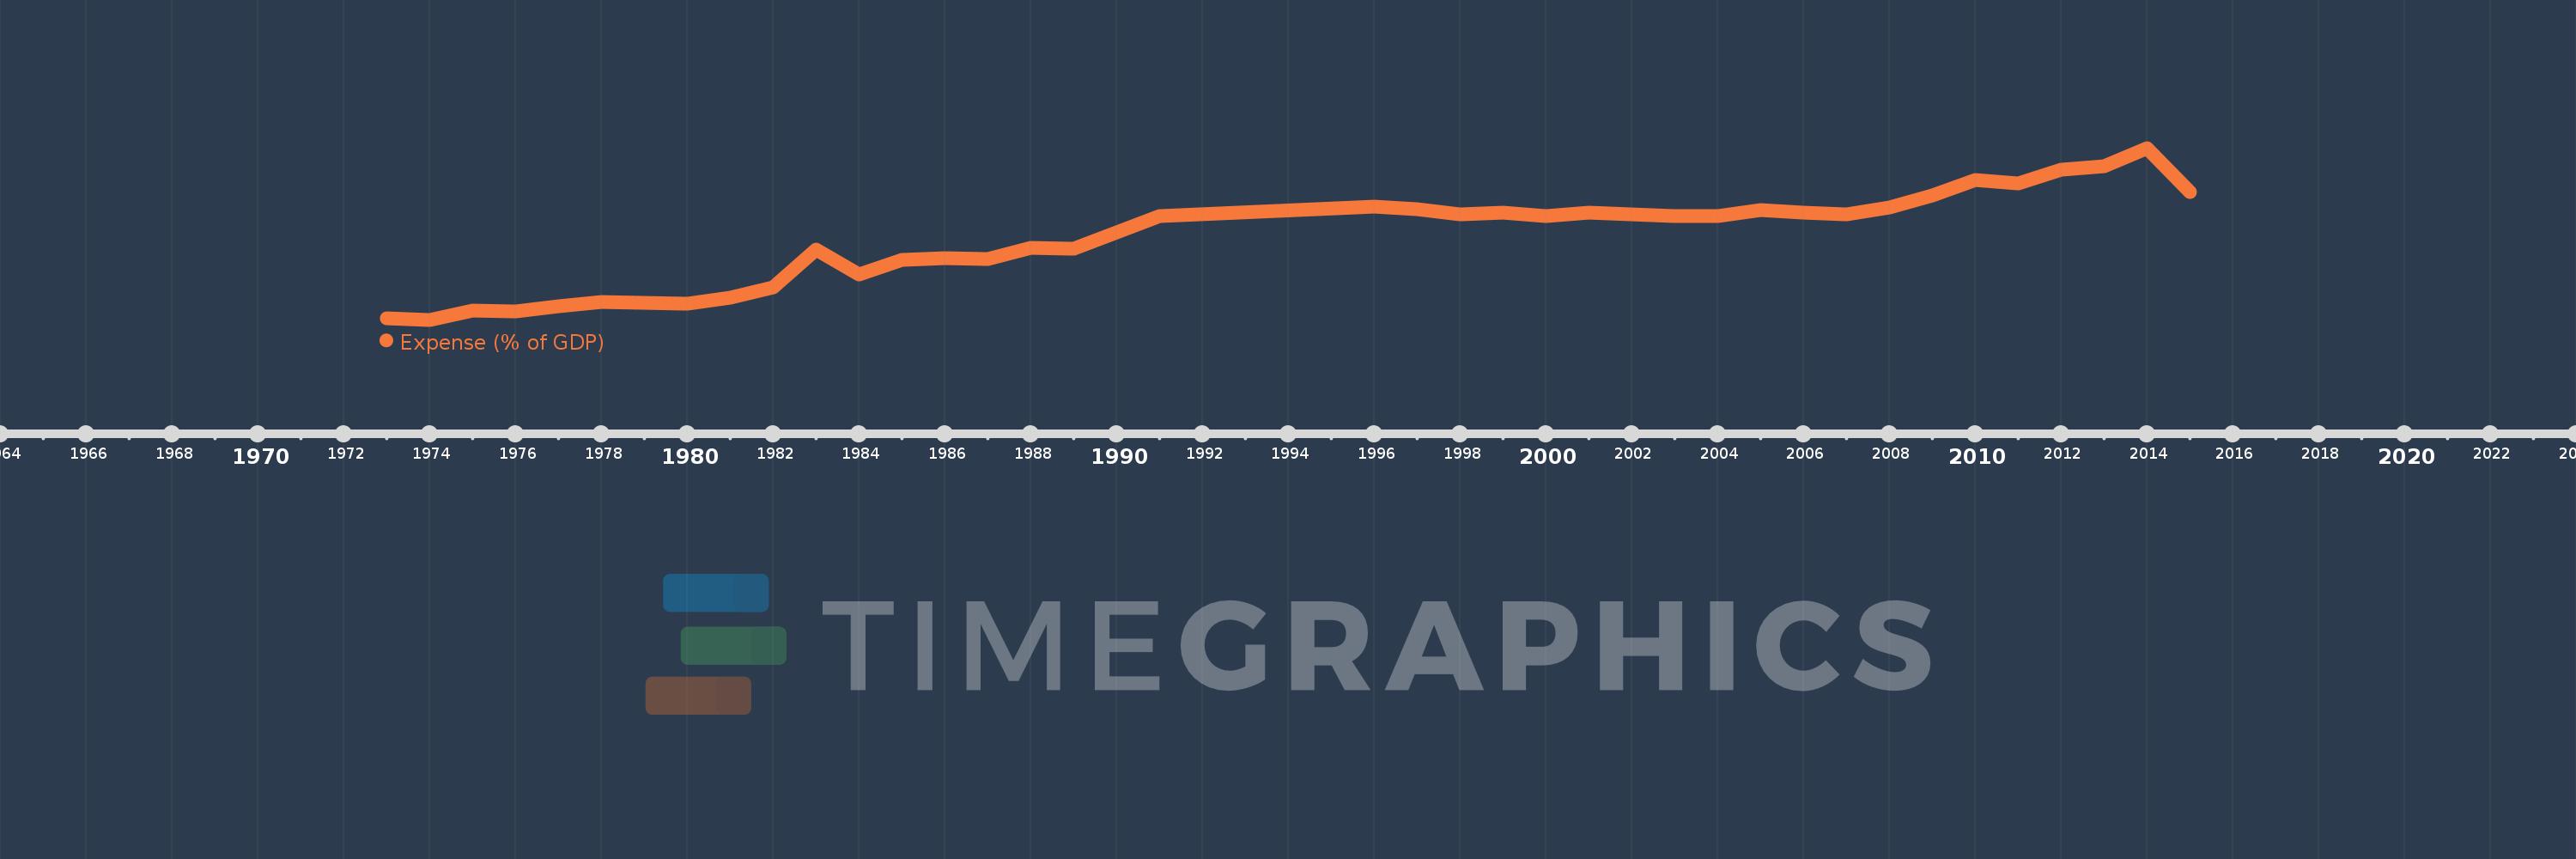
Greece
GRC
true
2
1
Expense (% of GDP)
2015,2014,2013,2012,2011,2010,2009,2008,2007,2006,2005,2004,2003,2002,2001,2000,1999,1998,1997,1996,1991,1990,1989,1988,1987,1986,1985,1984,1983,1982,1981,1980,1979,1978,1977,1976,1975,1974,1973
This statistics in other country:
AfghanistanAlbaniaAlgeriaAngolaAntigua and BarbudaArmeniaAustraliaAustriaAzerbaijanBahamas, TheBahrainBangladeshBarbadosBelarusBelgiumBelizeBeninBhutanBoliviaBosnia and HerzegovinaBotswanaBrazilBulgariaBurkina FasoBurundiCabo VerdeCambodiaCanadaCaribbean small statesCentral African RepublicCentral Europe and the BalticsChileColombiaCongo, Dem. Rep.Congo, Rep.Costa RicaCote d'IvoireCroatiaCyprusCzech RepublicDenmarkDominicaDominican RepublicEarly-demographic dividendEgypt, Arab Rep.El SalvadorEquatorial GuineaEstoniaEthiopiaEuro areaEurope & Central AsiaEurope & Central Asia (excluding high income)Europe & Central Asia (IDA & IBRD countries)European UnionFijiFinlandFranceGambia, TheGeorgiaGermanyGhanaGreeceGrenadaGuatemalaHeavily indebted poor countries (HIPC)High incomeHondurasHong Kong SAR, ChinaHungaryIcelandIDA blendIDA onlyIDA totalIndiaIndonesiaIran, Islamic Rep.IraqIrelandIsraelItalyJamaicaJapanJordanKazakhstanKenyaKiribatiKorea, Rep.KuwaitKyrgyz RepublicLao PDRLatin America & Caribbean Latin America & Caribbean (excluding high income)Latin America & the Caribbean (IDA & IBRD countries)LatviaLeast developed countries: UN classificationLebanonLesothoLiberiaLithuaniaLow incomeLower middle incomeLuxembourgMacao SAR, ChinaMacedonia, FYRMadagascarMalawiMalaysiaMaldivesMaliMaltaMauritiusMexicoMicronesia, Fed. Sts.Middle East & North Africa (excluding high income)Middle East & North Africa (IDA & IBRD countries)MoldovaMongoliaMoroccoMozambiqueMyanmarNamibiaNepalNetherlandsNew ZealandNicaraguaNigeriaNorth AmericaNorwayOECD membersOmanOther small statesPacific island small statesPakistanPanamaPapua New GuineaParaguayPeruPhilippinesPolandPortugalPost-demographic dividendPre-demographic dividendQatarRomaniaRussian FederationRwandaSamoaSan MarinoSao Tome and PrincipeSenegalSerbiaSeychellesSierra LeoneSingaporeSlovak RepublicSloveniaSmall statesSolomon IslandsSouth AfricaSouth AsiaSouth Asia (IDA & IBRD)SpainSri LankaSt. Kitts and NevisSt. LuciaSub-Saharan Africa Sub-Saharan Africa (excluding high income)Sub-Saharan Africa (IDA & IBRD countries)SurinameSwazilandSwedenSwitzerlandSyrian Arab RepublicTajikistanTanzaniaThailandTimor-LesteTogoTrinidad and TobagoTunisiaTurkeyUgandaUkraineUnited Arab EmiratesUnited KingdomUnited StatesUruguayVanuatuVenezuela, RBVietnamWest Bank and GazaWorldYemen, Rep.ZambiaZimbabwe Timeline:
This timeline shows a graph from 1973 to 2015 of Greece. No data until 1972. Number of actual observations by date: 39.
Source name:
World Development Indicators
Source organization:
International Monetary Fund, Government Finance Statistics Yearbook and data files, and World Bank and OECD GDP estimates.
Categories, topics:
Economy & Growth, Public Sector
Last updated:
apr 23, 2017
Indicators value changes by year
Maximum:
59.842
jan 1, 2014
At the date of observation
Value
Absolute change
Change from previous value
jan 1, 1973
16.094
+16.094
0.0%
jan 1, 1974
15.81
-0.285
-1.77%
jan 1, 1975
18.2
+2.39
15.12%
jan 1, 1976
17.905
-0.295
-1.62%
jan 1, 1977
19.364
+1.459
8.15%
jan 1, 1978
20.309
+0.946
4.88%
jan 1, 1979
20.153
-0.156
-0.77%
jan 1, 1980
19.976
-0.176
-0.88%
jan 1, 1981
21.398
+1.422
7.12%
jan 1, 1982
24.177
+2.78
12.99%
jan 1, 1983
33.697
+9.519
39.37%
jan 1, 1984
27.379
-6.318
-18.75%
jan 1, 1985
31.246
+3.867
14.12%
jan 1, 1986
31.579
+0.333
1.07%
jan 1, 1987
31.398
-0.181
-0.57%
jan 1, 1988
34.339
+2.941
9.37%
jan 1, 1989
34.126
-0.213
-0.62%
jan 1, 1990
38.272
+4.146
12.15%
jan 1, 1991
42.29
+4.018
10.5%
jan 1, 1996
44.767
+2.477
5.86%
jan 1, 1997
44.17
-0.598
-1.33%
jan 1, 1998
42.814
-1.356
-3.07%
jan 1, 1999
43.197
+0.383
0.89%
jan 1, 2000
42.304
-0.893
-2.07%
jan 1, 2001
43.344
+1.04
2.46%
jan 1, 2002
42.87
-0.474
-1.09%
jan 1, 2003
42.429
-0.441
-1.03%
jan 1, 2004
42.437
+0.008
0.02%
jan 1, 2005
43.847
+1.41
3.32%
jan 1, 2006
43.372
-0.475
-1.08%
jan 1, 2007
42.847
-0.524
-1.21%
jan 1, 2008
44.5
+1.652
3.86%
jan 1, 2009
47.706
+3.206
7.2%
jan 1, 2010
51.696
+3.99
8.36%
jan 1, 2011
50.854
-0.841
-1.63%
jan 1, 2012
54.327
+3.472
6.83%
jan 1, 2013
55.125
+0.799
1.47%
jan 1, 2014
59.842
+4.716
8.56%
jan 1, 2015
48.494
-11.348
-18.96%
Ranking of countries by current statistics by years


Comments: